Recently, I have spent a lot of time monitoring Linux servers with the Telegraf agent in VCF Operations. This includes metrics such as /boot, /var, /var/log, etc. This was fairly easy to implement. However, I also wanted to be able to monitor datastores under /mnt. It turned out that these metrics are not available by default after installing the Telegraf agent.

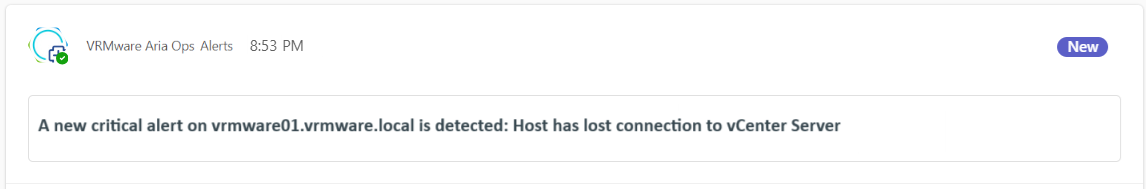
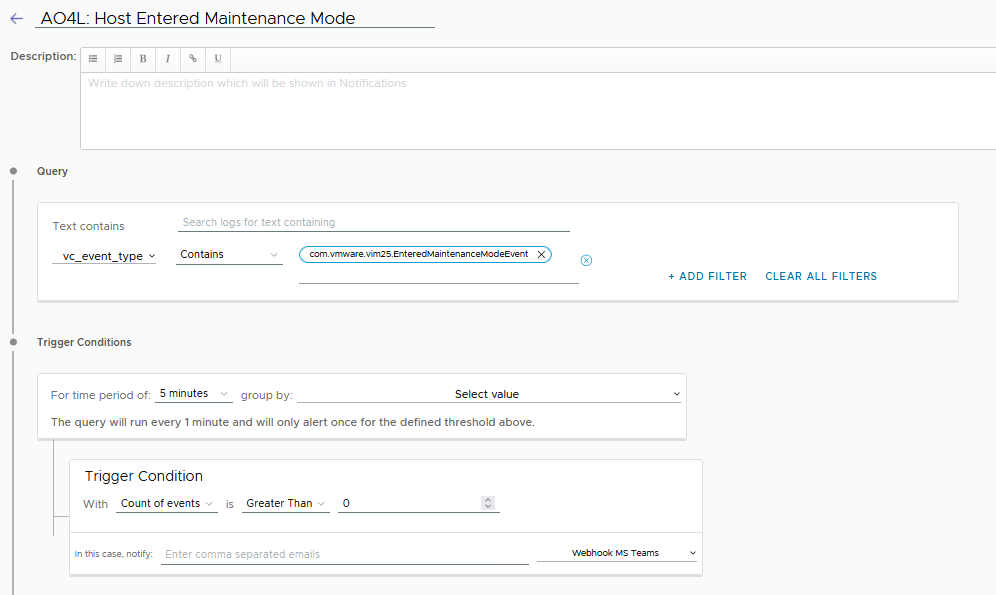
Objective: Raise an alert when a datastore under /mnt exceeds 75% capacity.
After installing the Telegraf agent on a Linux server, the following directory was created: /opt/vmware. In this directory, I created the following bash script: pct_used.sh. Please note that a script is executed from Telegraf using the system account arcuser. The arcuser account must have read and execute permissions for the script. Set the permissions using the following command:
chmod 755 /opt/vmware/pct_used.sh
The script below is a generic script for reading the % used from the datastores under /mnt. By providing the correct arguments you will receive a value (Use%) that you can use as a metric in VCF Operations as input for the alert. In the following examples:
- store1 = Linux Server
- 001 = Datastore 001
- 002 = Datastore 002
Examples:
root@vrmware001:/opt/vmware# ./pct_used.sh /mnt/store1/001
Result: 70
root@vrmware001:/opt/vmware# ./pct_used.sh /mnt/store1/002
Result: 64
Please note that the system account arcuser also has read + execute permissions on the /mnt and /mnt/server directory. In the examples mentioned above, this means that these rights must be located on /mnt/store1. Here’s how to do it.
- chmod 755 /mnt
- chmod 755 /mnt/store1
With the next command you can check if the arcuser account have permissions the read the datastores.
sudo -u arcuser df -P /mnt/store1/001 where /mnt/store1/001 should be replaced with your own datastore path.
#!/usr/bin/env bash
# Usage: ./pct_used.sh /mnt/store1/001

set -euo pipefail

MOUNT_PATH="${1:-}"

# Check if argument is provided
if [[ -z "$MOUNT_PATH" ]]; then
  echo "Usage: $0 <mount_path>" >&2
  exit 2
fi

# Check if argument is provided
if [[ ! -d "$MOUNT_PATH" ]]; then
  echo "Path not found: $MOUNT_PATH" >&2
  exit 3
fi

# Get percentage used via df; NR==2 = the data row
# +0 forces numeric output (strips '%')
pct_used="$(df -P "$MOUNT_PATH" 2>/dev/null | awk 'NR==2{print $5+0}')"

# Validate: empty or not numeric?
if [[ -z "$pct_used" || ! "$pct_used" =~ ^[0-9]+$ ]]; then
  echo "Unable to read usage for: $MOUNT_PATH" >&2
  exit 4
fi

# Output only the number to stdout (for Telegraf)
echo "$pct_used"
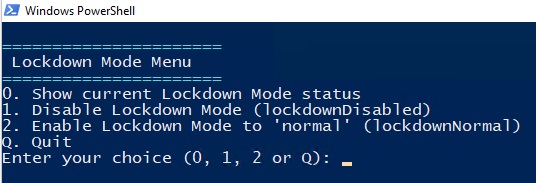
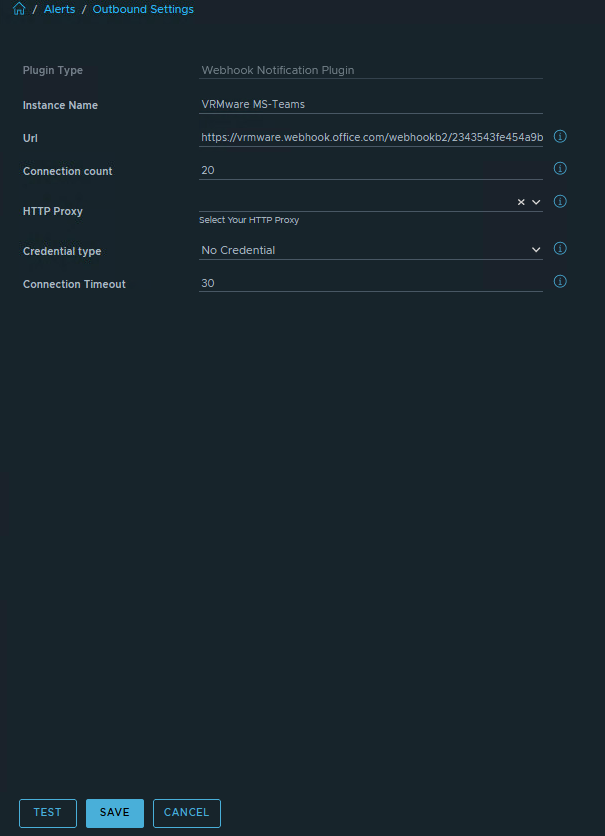
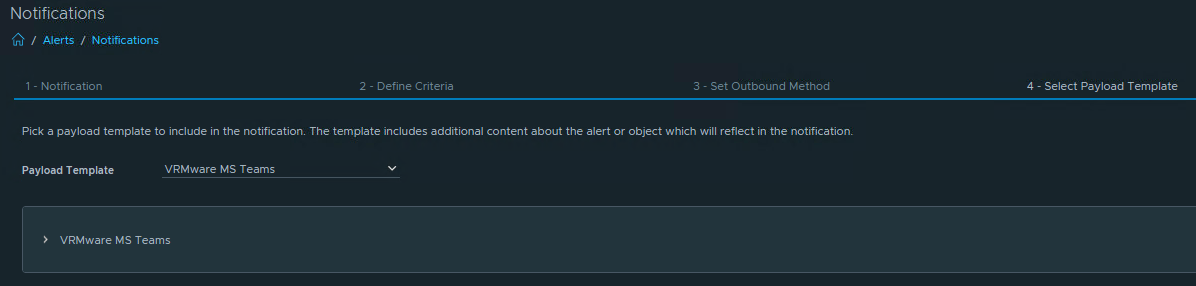
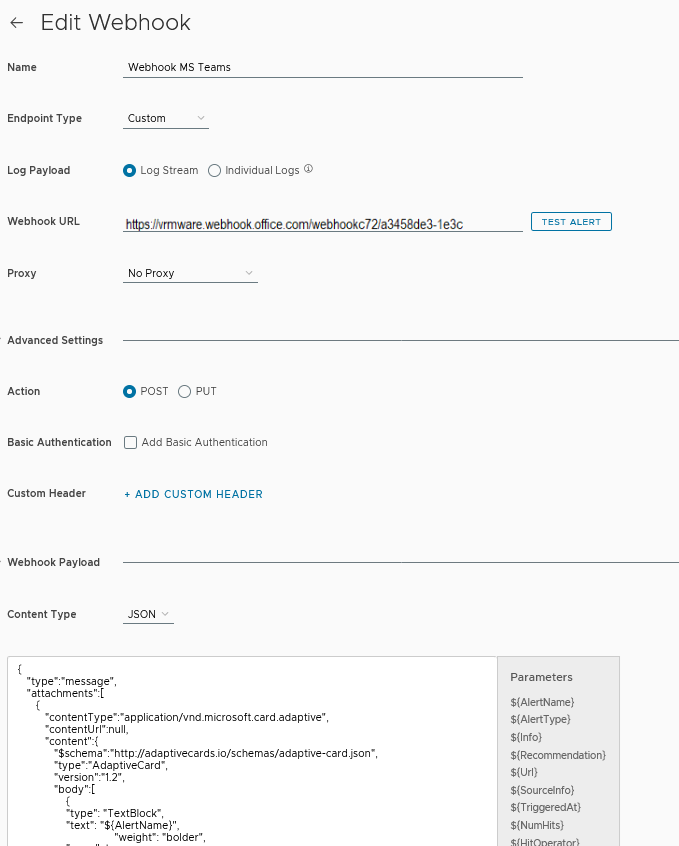
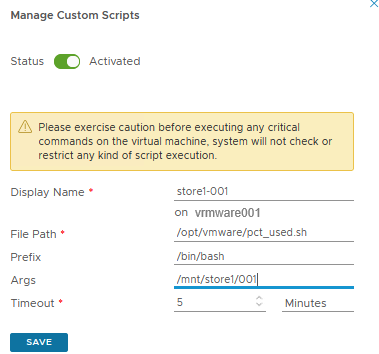
Now the script must be launched from VCF Operations.
Go to Manage Telegraf Agents section, select your favourite Linux server and add a Custom Script.
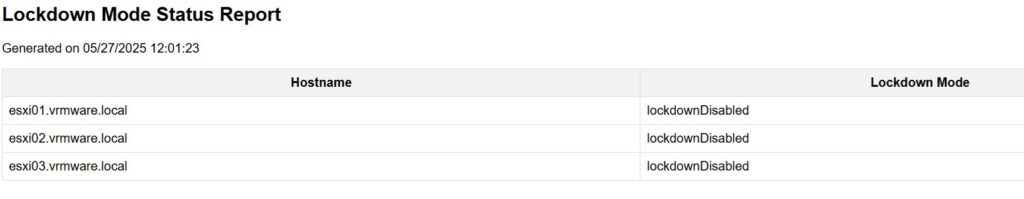
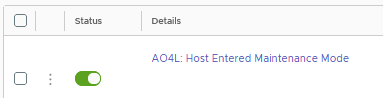
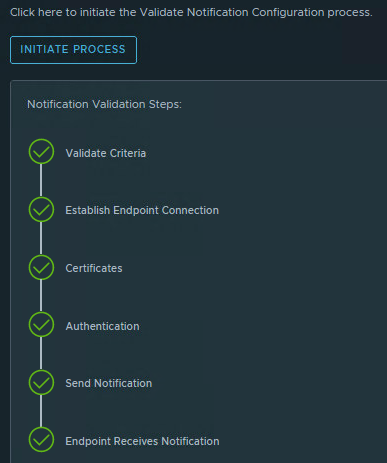
If the custom script is configured correctly, the first data should arrive after 5 to 10 minutes. You can see one of the following two statuses at the Telegraf agent.
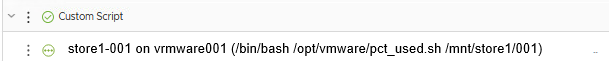
This means that the data is being received.
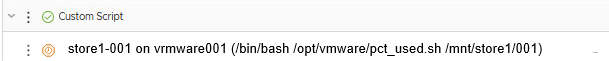
This means that the data has not changed since the previous measurement point.
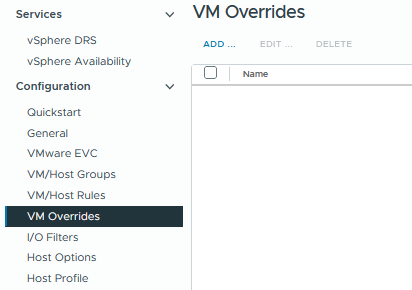
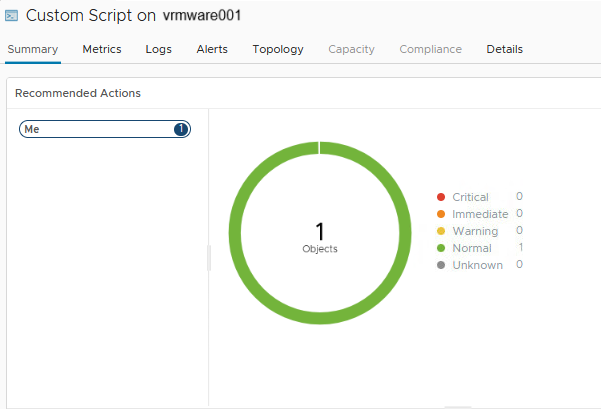
Go to the inventory view of the Linux server and select Custom Script. Check if the status is Normal (green).
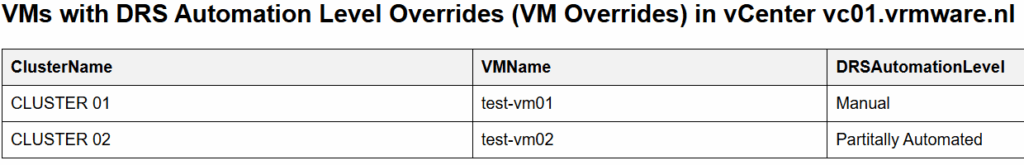
If the status is normal, go to the Metrics tab, Metrics, Scripts, Custom Script (store1-001). Double click on the Custom Script and there is the Metric value.
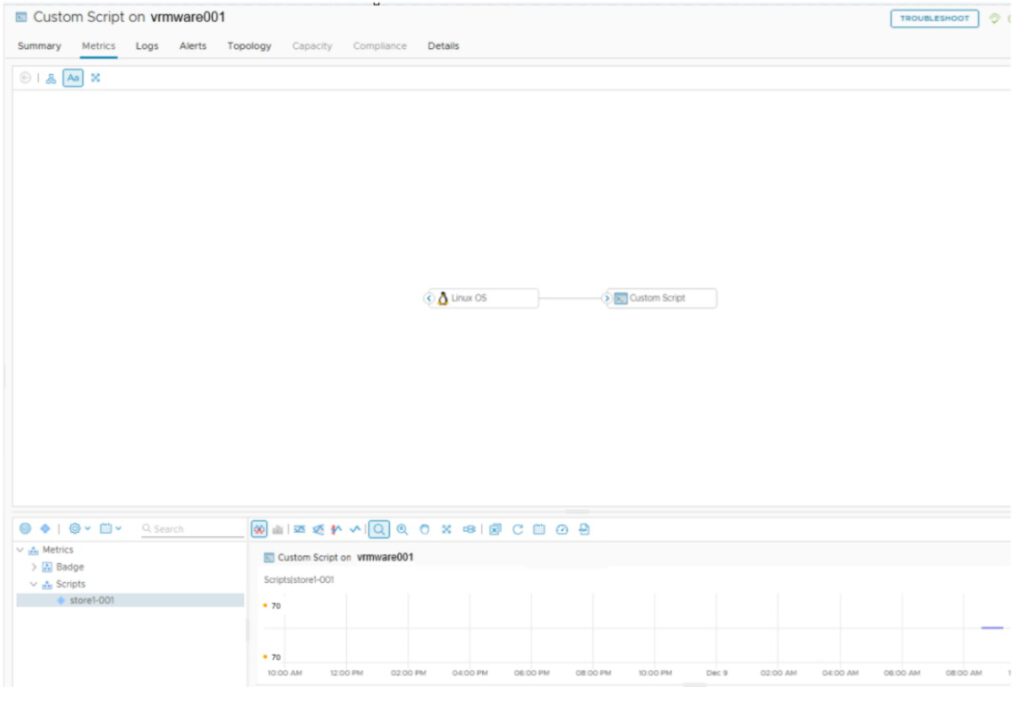
With these metrics, we can now create alerts (Use%) for datastores on Linux servers mounted under /mnt.
I tested it in my lab on both Aria Operations 8.18.5 and VCF Operations 9.0.1. It works on both versions.