vRealize Log Insight persistent static route on second network interface on behalf of Log Forwarding

Recently I wanted to test whether it is possible to configure vRealize Log Insight (vRLI) log forwarding to a second network interface to reach a log target in another network segment that could not be reached from the default vRLI appliance ip address.

The first step is adding a second network interface to the appliance. In this example we use the following network configuration.

  1. VMnic1
    Vlan10, IP 10.1.1.10, Subnetmask 255.255.255.0, Gateway 10.1.1.1
  2. VMnic2
    Vlan20, IP 20.2.2.20, Subnetmask 255.255.255.0, Gateway 20.2.2.1
  3. In this example the log forwarding target ip address is 30.3.3.233

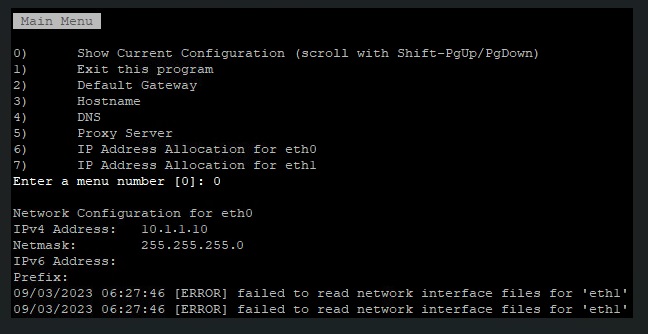
To configure the second network interface open a SSH session to vRLI appliance. Move to /opt/vmware/share/vami/ and run the network configuration script. vami_config_net. Eth1 is now also available for configuration. First select ‘0’ for a configuration overview. In the results is an error on eth1 displayed. This error keeps us from being able to configure eth1.

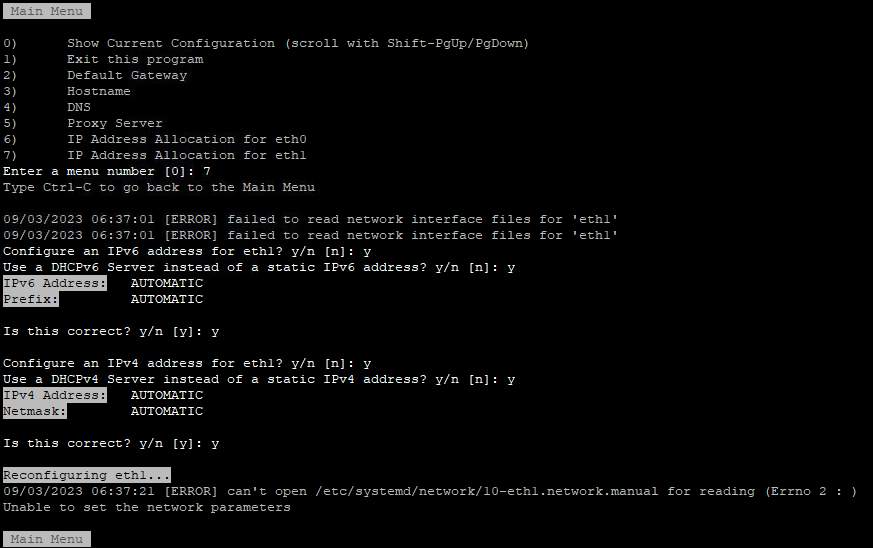
After some ‘Trial & Error’ research I noticed the following error during reconfiguring eth1 “can’t open /etc/systemd/network/10-eth1.network

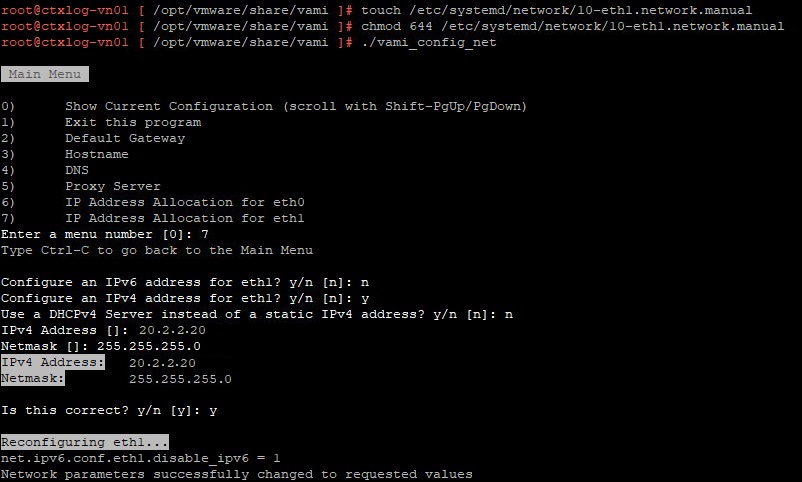
In the directory /etc/systemd/network is the file “10-eth1.network” not present. The name of the file could be different then here in this example. It depends on the number of network interfaces. I fixed this issue by creating this file manual.

  1. touch /etc/systemd/network/10-eth1.network
  2. chmod 644 /etc/systemd/network/10-eth1.network
  3. Config the second network interface. Go to the directory /opt/vmware/share/vami/ and run the network configution script. vami_config_net. Eth1 is now also available for configuation.
  4. Check the new configuration by selecting option 0. If Ok press 1 to exit
  5. Restart the network, systemctl restart systemd-networkd.service

Now this issue is fixed we can move on to configure the persistant static route for vRLI log forwarding.

Edit /etc/systemd/network/10-eth1.network

The file shlould look like this before editing:

[Match]
Name=eth1
[Network]

Gateway=10.1.1.1
Address=20.2.2.20/24
DHCP=no

[DHCP]
UseDNS=false

Now add route information at the end of the file:

[Match]
Name=eth1
[Network]

Gateway=10.1.1.1
Address=20.2.2.20/24
DHCP=no

[DHCP]
UseDNS=false
[Route]
Gateway=20.2.2.1
Destination=30.3.3.233/24

Save the file and restart the network service.

systemctl restart systemd-networkd.service

Check if the new route is present.

route -n

Test if you reach the destionation from CLI. I used Syslog over UDP port 514.

nc -v 30.3.3.233 514

Answer if configuration is working:

[30.3.3.233 514] open

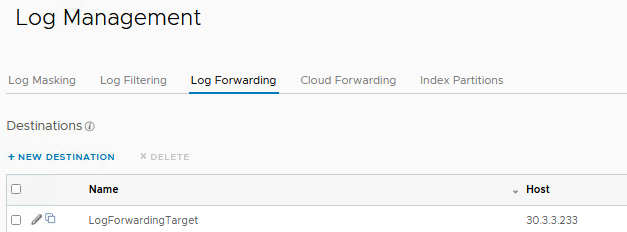
The last step is to configure the vRLI Log Forwarding Destination.

Send a test event and check if the event is received by the target.

Keep in mind that multic-nic configurations in vRLI are not officially supported.

Also credits to this blog post that pushed me in the right direction.

VMware Vrealize Log Insight upgrade from CLI

Did you know that you can also upgrade vReaze Log Insight from the CLI?

  • Upload the .PAK file to /tmp on the Log Insight appliance
  • Open 2 ssh sessions to the Log Insight appliance
  • Run the following Python script: /usr/lib/loginsight/application/sbin/loginsight-pak-upgrade.py /tmp/VMware-vRealize-Log-Insight-8.6.0-18703301.pak
  • Open the second ssh session to follow the progress in realtime in the upgrade log.
    tail -f /var/log/loginsight/upgrade.log

When the upgrade is finished the ssh sessions will be ended while the Log Insight aplliance is rebooting.

Done!

Configure VxRail Manager forward logs to vRealize Log Insight

This post is written by Steve Hagerty. Since I find this a very valuable blog, I have decided reblogging this article. The original article can be found here.

This is a short post to explain how to configure syslog forwarding from VxRail Manager to vRealize Log Insight.

Depending on the deployment scenario, VxRail may or may not be automatically configured to forward all of its associated logs to vRealize Log Insight. For example with VCF on VxRail, this configuration is automated for all VxRail components, while in other situations this may need to be configured manually.

There are three primary VxRail components to configure:

  • VxRail Manager
  • vCenter Server
  • ESXi Hosts

… with the iDRAC of each VxRail node also being an option.

The configuration of the VxRail vCenter Server in vRLI can also incorporate configuring the log forwarding from the associated ESXi hosts if selected, as shown below:

This is all managed under the built-in vSphere integrations for vRLI. What remains then, if required, is to configure VxRail Manager to forward its logs (marvin.log) to vRLI.

As described in KB504644 VxRail: How to configure a new syslog server , SSH to VxRail Manager as mystic user and switch user to root user, before editing the /etc/rsyslog.conf file with the following additional entries:

#
# Marvin log to loginsight
#
$ModLoad imfile
$InputFileName /var/log/vmware/marvin/tomcat/logs/marvin.log
$InputFileTag VxRail
$InputFileStateFile VxRail-Log-State
$InputRunFileMonitor
*.* @<customer remote server ip:514>

Advertisementshttps://c0.pubmine.com/sf/0.0.3/html/safeframe.htmlREPORT THIS ADPRIVACY

Ideally you should use the Log Insight load balancer IP as the target for the <customer remote server ip> (syslog/vRLI server IP), where 514 is the udp port.

Update 31/03/2021: In additional, to the above, the /var/log/mystic/connectors-cluster.log and the /var/log/mystic/connectors-esrs.log can be added to this list, simply by adding them as additional $InputFileName line items, as shown below:

Restart the syslog service using command on VxRail Manager: service rsyslog restart (or reboot the VxRail Manager VM if required).

We can then confirm that the vRLI system is receiving the forwarded logs from our VxRail Manager (vcf2mgmtvxrmgr) in the vRLI UI under Administration > Hosts

Advertisementshttps://c0.pubmine.com/sf/0.0.3/html/safeframe.htmlREPORT THIS ADPRIVACY

On the Interactive Analytics tab we can filter for the VxRail Manager hostname of vcf2mgmtvxrmgr in order to get more detail on each event received since the log forwarding was configured.

The events received from the VxRail Manager source will automatically be included in the General vRLI Dashboard, as shown below

It is also possible to create your own custom VxRail dashboard in vRLI if required. A new (VxRail) dashboard can be created under My Dashboards, where new and existing widgets can be copied and modified as required.

For completeness, if a customer requires the iDRAC logs of the VxRail nodes to be forwarded to vRLI also, then please take a look at this post which covers the required steps, leveraging the Dell iDRAC Content Pack for vRLI, installable directly from the vRLI Content Pack Marketplace, as shown below:

Advertisementshttps://c0.pubmine.com/sf/0.0.3/html/safeframe.htmlREPORT THIS ADPRIVACY

And that’s about it really, I hope that helps!

Steve

Early notification of vmhba resets in a vSAN cluster

In the past years, I have experienced some vSAN performance issues due to faulty hardware. The goal was to know at an early stage whether there are hardware errors that can lead to performance degradation.

One problem I’ve seen a few times are hardware related problems that lead to a high latency, outstanding io’s and congestions at the backend storage. I was wondering if it is possible to spot these kinds of issues earlier? I started searching in vRealize Log Insight.

I found some events afterwards during my research. In the period prior to the performance issues, many “Power-on Reset on vmhba” messages had been written in the vobd.log and vmkernel.log. At first it was a few events per day, but as time passed the frequency with which the events came increasingly higher and finally led to a very poor vSAN performance.

In the following steps I will explain how you can define an email alert in vRealize Log Insight that helps to detect this kind of issues at an early stage. Now it’s possbile to take early action to avoid potential problems.

Step 1. Create a query that search for “Power-on Reset occurred on vmhba” events

Step 2. Create an alert from the query

Step 3. Define the alert