Recieve VMware Aria Operations for Logs Alerts in Microsoft Teams

This blog is meant to keep up to date on important infrastructure alerts during and outside office hours with standard products such as VMware Aria Operations for Logs (AO4L) and Microsoft (MS)Teams.

Use Case – Increase the ability to notice prio 1 alerts outside of office hours with the available technical resources.

Goal – In addition to the standard AO4L alerts, we also want to have the option available to receive alerts through Microsoft Teams.

Solution – Use AO4L Webhook to send alerts to MS Teams

Setup – In order to have AO4L alerts sent to MS Teams, we need to set up two things.

  1. Setup a MS Teams Connector to receive alerts
  2. Setup the AO4L Webhook configuration to push alerts

Setup a MS Teams Connector to receive alerts

First, decide in which Teams Channel you want to receive the AO4L alerts or add a new Teams Channel. I have created a new Channel called VRMware VMware Alerts.

Click on the 3 dots on the right side and select Manage Channel.

Select Edit under Connectors.

Select Incoming Webhook and hit the Configure button.

Provide a friendly name, upload an image and create the connector.

After creation copy the url to the clipboard. We need this URL later to configure the AO4L Webhook.

Before we move on to AO4L we need to enable the channel notifications. Click once again on the 3 dots on the right side and select Channel notifications > All New Posts.

Setup the AO4L Webhook configuration to push alerts

Go to the Administration section and open Configuration > Webhook > New Webhook. Choose a name. From the Endpoint drop down menu select Custom. Copy the Webhook URL that was copied from MS Teams connector. From the Content Type drop down menu select JSON and from the Action drop down menu select POST. The Webhook Payload will be described under the picture.

Webload Payload

The Webload Payload was the hardest part to figuring it out how the Webhook Payload layout should look like.

As far as I know from AO4L Webhook, only clear text can be used to send notifications to MS Teams. It’s possible to use one or more parameters in the script. For an overview of the parameters see the picture above here. Because the notictions are send in clear text it’s not possible to use all parameters. In our case not a problem because MS Teams is not used to replace monitoring software. It is just an additional option to be informed in a timely manner.

I wouldn’t go indepth how I found out the layout of the Webhook Payload code. That’s why I’m only sharing the code with you, so you can start testing for yourself.

{
"type":"message",
"attachments":[
{
"contentType":"application/vnd.microsoft.card.adaptive",
"contentUrl":null,
"content":{
"$schema":"http://adaptivecards.io/schemas/adaptive-card.json",
"type":"AdaptiveCard",
"version":"1.2",
"body":[
{
"type": "TextBlock",
"text": "${AlertName}",
"weight": "bolder",
"wrap": true
}
]
}
}
]
}

After completing the Webhook configuration you may want test the Webhook configartion. Press the Send Test button

Finally Save the Webhook configuration.

Open the MS Teams Channel where the connector was created earlier. You should see here the Test Alert.

The last part is sending a notification to MS Teams when a ESXi host have entered Maintenance Mode.

I have created an AO4L alert with the name “AO4L Alert: Host entered Maintenance Mode“.

I have decided that I would like to be notified by MS Teams. This can be set under the Trigger Conditions.

If everything is configured correctly we should receive the Send Test Alert Results after sending a test alert.

Save the Alert. Now we are ready for the final test. I put a ESXi host in maintenance mode and we should receive within 5 minutes a MS Teams notification. It works!

I hope this blog post will help you configure AO4L to send notifications to MS Teams. Please remember that MS Teams is not a monitoring tool. So be selective with the alerts you forward.

UPDATE: Aria Operations for Logs persistent static route on second network interface on behalf of Log Forwarding

There is an update on the blog post “vRealize Log Insight persistent static route on second network interface on behalf of Log Forwarding”. Beginning with version Aria Operations for Logs 8.14, the VAME_CONF_NET is no longer available, it’s removed in this version.

The information in the orignal blog post can still be used. Only now you need to manually create and predefine the 10-eth1.network configuration. See example at the bottom of the original post.

There are two important things to consider:

  1. Keep in mind that multic-nic configurations in Aria Ops for Logs is not officially supported
  2. After every update the 2nd interface must be recreated and configured again

Orginal post:

Recently I wanted to test whether it is possible to configure vRealize Log Insight (vRLI) log forwarding to a second network interface to reach a log target in another network segment that could not be reached from the default vRLI appliance ip address.

The first step is adding a second network interface to the appliance. In this example we use the following network configuration.

  1. VMnic1
    Vlan10, IP 10.1.1.10, Subnetmask 255.255.255.0, Gateway 10.1.1.1
  2. VMnic2
    Vlan20, IP 20.2.2.20, Subnetmask 255.255.255.0, Gateway 20.2.2.1
  3. In this example the log forwarding target ip address is 30.3.3.233

To configure the second network interface open a SSH session to vRLI appliance. Move to /opt/vmware/share/vami/ and run the network configuration script. vami_config_net. Eth1 is now also available for configuration. First select ‘0’ for a configuration overview. In the results is an error on eth1 displayed. This error keeps us from being able to configure eth1.

After some ‘Trial & Error’ research I noticed the following error during reconfiguring eth1 “can’t open /etc/systemd/network/10-eth1.network

In the directory /etc/systemd/network is the file “10-eth1.network” not present. The name of the file could be different then here in this example. It depends on the number of network interfaces. I fixed this issue by creating this file manual.

  1. touch /etc/systemd/network/10-eth1.network
  2. chmod 644 /etc/systemd/network/10-eth1.network
  3. Config the second network interface. Go to the directory /opt/vmware/share/vami/ and run the network configution script. vami_config_net. Eth1 is now also available for configuation.
  4. Check the new configuration by selecting option 0. If Ok press 1 to exit
  5. Restart the network, systemctl restart systemd-networkd.service

Now this issue is fixed we can move on to configure the persistant static route for vRLI log forwarding.

Edit /etc/systemd/network/10-eth1.network

The file shlould look like this before editing:

[Match]
Name=eth1
[Network]

Gateway=10.1.1.1
Address=20.2.2.20/24
DHCP=no

[DHCP]
UseDNS=false

Now add route information at the end of the file:

[Match]
Name=eth1
[Network]

Gateway=10.1.1.1
Address=20.2.2.20/24
DHCP=no

[DHCP]
UseDNS=false
[Route]
Gateway=20.2.2.1
Destination=30.3.3.233/24

Save the file and restart the network service.

systemctl restart systemd-networkd.service

Check if the new route is present.

route -n

Test if you reach the destionation from CLI. I used Syslog over UDP port 514.

nc -v 30.3.3.233 514

Answer if configuration is working:

[30.3.3.233 514] open

The last step is to configure the vRLI Log Forwarding Destination.

Send a test event and check if the event is received by the target.

Keep in mind that multic-nic configurations in vRLI are not officially supported.

Also credits to this blog post that pushed me in the right direction.

PowerCLI script to get Syslog.Global.Host advanced setting

The following script may be useful if you are in the process of migrating vRealize Log Insight to a new appliance/cluster. You can use this script before, during and after migrating to check the settings of Syslog.Global.Loghost of all ESXi hosts in vCenter.

# Connect to vCenter Server
Connect-VIServer <vCenterServer>

# Get all ESXi hosts in the cluster
$hosts = get-vmhost

# Loop through each ESXi host and get the syslog.global.loghost advanced setting
foreach ($esxi in $hosts) {
    $setting = Get-AdvancedSetting -Entity $esxi -Name 'syslog.global.loghost'
    Write-Host "$($esxi.Name): $($setting.Value)"
}

# Disconnect from vCenter Server
Disconnect-VIServer <vCenterServer> -Confirm:$false

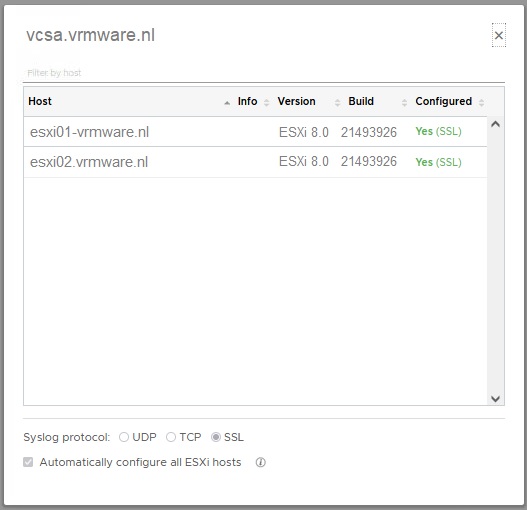
For example: You can use the script during vRealize Log Insight in the following way:

  • Before migration
    Check the current configured syslog endpoint
  • During migration
    Check the current and new syslog endpoints are configured
  • After migration
    Check the new configured syslog endpoint

vRealize Log Insight Admin Alert: SSL Certificate Error (Host =vrli.vrmware.nl)

This time a short post about a vRealize Log Insight (vrLI) configuration issue that took too long to solve. In the end, the solution is simple after I found the documentation. Finding the right documentation was the hardest part.

Just briefly the reason of this setup. I want ESXi hosts to use Syslog over SSL to send logging encrypted to vRLI.

While adding the vCenter I configured the hosts to use SSL.

After configuring, everything seemed to work fine, until I got a vRLI Admin mail with the following alert:

This alert is about your Log Insight installation on https://vrli.vrmware.nl/

SSL Certificate Error (Host = vrli.vrmware.nl) triggered at 2023-04-16T09:23:53.412Z

This notification was generated from Log Insight node (Host = vrli.vrmware.nl, Node Identifier = de568ad3-d4e3-7f8a-b543-cef17632af11).

Syslog client esx01.vrmware.nl disconnected due to a SSL handshake problem. This may be a problem with the SSL Certificate or with the Network Time Service. In order for Log Insight to accept syslog messages over SSL, a certificate that is validated by the client is required and the clocks of the systems must be in sync.

Log messages from esx01.vrmware.nl are not being accepted, reconfigure that system to not use SSL or see Online Help for instructions on how to install a new SSL certificate .

This message was generated by your Log Insight installation, visit the Documentation Center for more information.

Time couldn’t be the issue in my case. So it had to be a certificate issue. The issue was caused by the vRLI certificate that wasn’t in the ESXi host truststore.

Per ESXi host, the following steps should be taken to solve the issue. Step 3 is only a verification step.

  1. openssl s_client -connect [FDQN or IP vRLI]:1514 < /dev/null | openssl x509 -outform PEM >> /etc/vmware/ssl/castore.pem
    Example: openssl s_client -connect vrli.vmware.nl:1514 < /dev/null | openssl x509 -outform PEM >> /etc/vmware/ssl/castore.pem
  2. esxcli system syslog reload
  3. esxcli network ip connection list | grep 1514

If ESXi hosts have the vRLI certificate in their truststore, the vRLI Admin mail (1x per day per vRLI node) should no longer occur.

Here is the link to the VMware documentation. This documentation is actually for vRLI Cloud which is a different product than standard vRLI although they overlap in some areas. The documentation for vRLI will be updated according to VMware GSS.

So this is probably why the vRLI documentation on this topic was so hard to find. Hopefully this blog post will save you a lot of time.