If you’ve ever spent time patching a set of ESXi hosts, the following scenario will likely feel all too familiar.
You kick off the deployment of a new cluster image in a VMware HA cluster. Everything starts smoothly, updates are rolling out, hosts are entering maintenance mode as expected, and for a moment it feels like a smooth upgrade. But then, suddenly, progress comes to a halt. One of the hosts refuses to enter maintenance mode, and the entire update process gets stuck.

In most cases, the root cause isn’t immediately obvious. You might start checking DRS settings, VM migrations, or resource constraints. However, more often than not, the issue comes down to a virtual machine that cannot be migrated due to a dependency on the host. A common cause here is a VM configured with Virtual SCSI Bus Sharing.
From my experience, when this happens, there’s usually one or multiple VMs configured with Virtual SCSI Bus Sharing enabled. Because of this configuration, vMotion is restricted, and the VM becomes “pinned” to its current host. As a result, the host cannot evacuate all workloads and is therefore unable to enter maintenance mode, blocking your patching workflow.
To avoid running into this situation mid-update, it would be incredibly helpful to have visibility into these VMs beforehand. Imagine having a simple report that lists all VMs with Virtual SCSI Bus Sharing enabled across your environment. You could proactively address potential blockers, scheduling downtime, or planning the update sequence more carefully. With that insight and with a bit of help from Claude AI, this script was created.
In short, a bit of preparation goes a long way. Identifying these special cases in advance can save you from frustrating interruptions and ensure your ESXi patching process runs smoothly from start to finish.
The Find-SharedSCSI-BusOnly.ps1 script generates this overview and works with vCenter read-only permissions.
<#
.SYNOPSIS
Report VMs that have SCSI controllers with Bus Sharing enabled (Virtual/Physical).
.DESCRIPTION
- Scans VMs (optionally scoped by Datacenter(s) and Cluster(s)).
- Detects only SCSI controllers with BusSharing set to Virtual or Physical.
- Outputs a dark-themed HTML report and opens it in Edge (preferred), or Chrome/Firefox.
.NOTES
Script : Find-SharedSCSI-BusOnly.ps1
Version : 1.0
Author : Vincent Jansen
Blog : https://www.vrmware.nl
Tested : VMware vCenter 8.0.x
.CHANGELOG
v1.0.0 2026-05-19 VJ Initial release
.PARAMETER vCenter
One or more vCenter FQDN/IPs to connect to. If omitted, uses any existing PowerCLI session.
.PARAMETER Cluster
One or more cluster names to scope the check. If omitted, all clusters.
.PARAMETER Datacenter
One or more datacenter names to scope the check. If omitted, all datacenters.
.PARAMETER HtmlPath
Output path for the HTML report (default: .\SharedSCSIReport.html)
.PARAMETER Credential
PSCredential used to connect to vCenter(s). Overrides UserName/Password if supplied.
.PARAMETER UserName
vCenter username (used if -Credential not provided). If provided without -Password, a prompt will appear.
.PARAMETER Password
SecureString password for the given -UserName.
.EXAMPLE
.\Find-SharedSCSI-BusOnly.ps1 -vCenter vcsa01.lab.local -Cluster "Prod-HA-01" -Username "User01@lab.local"
.NOTES
Requires VMware.PowerCLI. Run: Install-Module VMware.PowerCLI
#>
[CmdletBinding()]
param(
[string[]] $vCenter,
[string[]] $Cluster,
[string[]] $Datacenter,
[string] $HtmlPath = ".\SharedSCSIReport.html",
[Parameter(ValueFromPipelineByPropertyName=$true)]
[System.Management.Automation.PSCredential] $Credential,
[string] $UserName,
[SecureString] $Password
)
# --- Preconditions -----------------------------------------------------------
if (-not (Get-Module -ListAvailable -Name VMware.PowerCLI)) {
Write-Error "VMware.PowerCLI module not found. Install with: Install-Module VMware.PowerCLI"
exit 1
}
Set-PowerCLIConfiguration -Scope User -ParticipateInCEIP $false -InvalidCertificateAction Ignore -Confirm:$false | Out-Null
# --- Build credential if needed ----------------------------------------------
if (-not $Credential) {
if ($UserName) {
if (-not $Password) {
$Password = Read-Host ("Enter password for {0}" -f $UserName) -AsSecureString
}
try {
$Credential = New-Object System.Management.Automation.PSCredential ($UserName, $Password)
} catch {
Write-Error ("Failed to construct PSCredential for {0}: {1}" -f $UserName, $_.Exception.Message)
exit 1
}
}
}
# --- vCenter connections (optional) ------------------------------------------
if ($vCenter) {
foreach ($vc in $vCenter) {
$already = $null
try { $already = Get-VIServer -Server $vc -ErrorAction Stop } catch {}
if (-not $already) {
try {
Write-Verbose ("Connecting to {0} ..." -f $vc)
if ($Credential) {
Connect-VIServer -Server $vc -Credential $Credential -ErrorAction Stop | Out-Null
} else {
Connect-VIServer -Server $vc -ErrorAction Stop | Out-Null
}
} catch {
Write-Warning ("Failed to connect to {0}: {1}" -f $vc, $_.Exception.Message)
}
}
}
}
# --- Scope selection ---------------------------------------------------------
$dcScope = if ($Datacenter) { Get-Datacenter -Name $Datacenter -ErrorAction SilentlyContinue } else { Get-Datacenter -ErrorAction SilentlyContinue }
if (-not $dcScope) { Write-Warning "No datacenters found in the current session/scope." }
$clusterScope = @()
foreach ($dc in $dcScope) {
if ($Cluster) {
$clusterScope += Get-Cluster -Location $dc -Name $Cluster -ErrorAction SilentlyContinue
} else {
$clusterScope += Get-Cluster -Location $dc -ErrorAction SilentlyContinue
}
}
$vms = if ($clusterScope) { $clusterScope | Get-VM -ErrorAction SilentlyContinue } else { Get-VM -ErrorAction SilentlyContinue }
if (-not $vms) { Write-Warning "No VMs found in the current scope."; $vms = @() }
# --- Helper: SCSI controller info only ---------------------------------------
function Get-ScsiControllerInfo {
param([VMware.VimAutomation.ViCore.Impl.V1.Inventory.VirtualMachineImpl] $Vm)
$hw = $Vm.ExtensionData.Config.Hardware
if (-not $hw) { return @() }
$controllers = $hw.Device | Where-Object {
$_ -is [VMware.Vim.ParaVirtualSCSIController] -or
$_ -is [VMware.Vim.VirtualLsiLogicController] -or
$_ -is [VMware.Vim.VirtualLsiLogicSASController] -or
$_ -is [VMware.Vim.VirtualBusLogicController]
}
foreach ($c in $controllers) {
$busSharingPretty = switch ($c.SharedBus) {
'noSharing' {'NoSharing'}
'virtualSharing' {'Virtual'}
'physicalSharing' {'Physical'}
default { [string]$c.SharedBus }
}
[pscustomobject]@{
VM = $Vm.Name
ControllerKey = $c.Key
ControllerType = $c.GetType().Name
BusNumber = $c.BusNumber
BusSharing = $busSharingPretty
}
}
}
# --- Analysis: only BusSharing findings --------------------------------------
Write-Verbose "Inspecting SCSI controllers (bus sharing only)..."
$results = New-Object System.Collections.Generic.List[object]
foreach ($vm in $vms) {
try {
$ctrls = Get-ScsiControllerInfo -Vm $vm
$sharedBusCtrls = $ctrls | Where-Object { $_.BusSharing -and $_.BusSharing -ne 'NoSharing' }
if ($sharedBusCtrls) {
$dcName = ($vm | Get-Datacenter -ErrorAction SilentlyContinue | Select-Object -ExpandProperty Name -First 1)
$clusterName = ($vm | Get-Cluster -ErrorAction SilentlyContinue | Select-Object -ExpandProperty Name -First 1)
foreach ($c in $sharedBusCtrls) {
$results.Add([pscustomobject]@{
Datacenter = $dcName
Cluster = $clusterName
VM = $vm.Name
PowerState = $vm.PowerState
ControllerType = $c.ControllerType
BusNumber = $c.BusNumber
BusSharing = $c.BusSharing
})
}
}
} catch {
Write-Warning ("Error analyzing VM '{0}': {1}" -f $vm.Name, $_.Exception.Message)
}
}
# --- Build HTML (dark theme) -------------------------------------------------
$now = Get-Date
$findings = $results | Sort-Object Cluster, VM, BusNumber
$totalFindings = $findings.Count
$totalVMs = ($findings | Select-Object -ExpandProperty VM -Unique).Count
$totalClusters = ($findings | Select-Object -ExpandProperty Cluster -Unique).Count
$clusterAgg = $findings | Group-Object Cluster | ForEach-Object {
[pscustomobject]@{
Cluster = $_.Name
VMs = ($_.Group | Select-Object -ExpandProperty VM -Unique).Count
Findings = $_.Count
}
} | Sort-Object Cluster
$css = @'
:root {
color-scheme: dark;
--bg: #0f1115; --panel: #141821; --text: #e5e7eb; --muted: #9ca3af;
--accent: #60a5fa; --border: #1f2937; --row: #0b0e14; --ok: #34d399; --danger:#f87171;
}
*{box-sizing:border-box}
body{margin:0;padding:24px;background:var(--bg);color:var(--text);font-family:system-ui,-apple-system,Segoe UI,Roboto,Ubuntu,Cantarell,Noto Sans,Arial,sans-serif}
h1,h2{margin:0 0 12px 0} h1{font-size:22px} h2{font-size:18px;color:var(--muted)}
.panel{background:var(--panel);border:1px solid var(--border);border-radius:10px;padding:16px;margin-bottom:16px}
.grid{display:grid;gap:16px;grid-template-columns:repeat(auto-fit,minmax(240px,1fr))}
.stat{display:flex;align-items:center;justify-content:space-between;padding:14px;background:#0c1220;border:1px solid var(--border);border-radius:10px}
.stat .label{color:var(--muted);font-size:12px} .stat .value{font-size:22px;font-weight:700}
.table-wrap{overflow:auto;max-height:60vh;border:1px solid var(--border);border-radius:10px}
table{width:100%;border-collapse:collapse}
thead th{position:sticky;top:0;background:#111827;color:var(--muted);text-align:left;padding:10px;font-weight:600;font-size:12px;cursor:pointer;user-select:none;border-bottom:1px solid var(--border)}
tbody td{padding:10px;border-bottom:1px solid var(--border);font-size:13px}
tbody tr:nth-child(even){background:var(--row)}
.badge{padding:2px 8px;border-radius:999px;font-size:12px;border:1px solid var(--border)}
.badge.on{color:var(--ok);background:rgba(52,211,153,.08);border-color:rgba(52,211,153,.4)}
.badge.off{color:var(--danger);background:rgba(248,113,113,.08);border-color:rgba(248,113,113,.4)}
.small{font-size:12px;color:var(--muted)}
.controls{display:grid;gap:12px;grid-template-columns:repeat(auto-fit,minmax(220px,1fr))}
'@
$js = @'
(function(){
const q = s => document.querySelector(s);
const rows = Array.from(document.querySelectorAll("tbody tr"));
let sortDir = 1, sortCol = -1;
function text(el){ return (el?.textContent || "").trim().toLowerCase(); }
function applyFilter(){
const fCluster = q("#fCluster").value.toLowerCase();
const fVM = q("#fVM").value.toLowerCase();
let visible = 0;
rows.forEach(tr=>{
const c = tr.children;
const cluster = text(c[1]);
const vm = text(c[2]);
const ok = (fCluster==="" || cluster.includes(fCluster))
&& (fVM==="" || vm.includes(fVM));
tr.style.display = ok ? "" : "none";
if(ok) visible++;
});
q("#visibleCount").textContent = visible;
}
function sortBy(colIdx){
const tbody = rows[0]?.parentElement; if(!tbody) return;
if(sortCol === colIdx){ sortDir = -sortDir; } else { sortCol = colIdx; sortDir = 1; }
const sorted = rows.slice().sort((a,b)=>{
const A = text(a.children[colIdx]), B = text(b.children[colIdx]);
const nA = parseFloat(A.replace(/[^0-9.\-]/g,"")), nB = parseFloat(B.replace(/[^0-9.\-]/g,""));
const bothNum = !isNaN(nA) && !isNaN(nB) && A.match(/^[\d .\-]+$/) && B.match(/^[\d .\-]+$/);
return (bothNum ? (nA-nB) : A.localeCompare(B)) * sortDir;
});
sorted.forEach(tr=>tbody.appendChild(tr));
}
["fCluster","fVM"].forEach(id => q("#"+id).addEventListener("input", applyFilter));
document.querySelectorAll("thead th").forEach((th,i)=> th.addEventListener("click", ()=>sortBy(i)));
applyFilter();
})();
'@
function Escape-Html {
param([AllowNull()] [string] $s)
if ($null -eq $s) { return "" }
($s -replace '&','&' -replace '<','<' -replace '>','>' -replace '"','"' -replace "'","'")
}
# Build rows (Bus-sharing only)
$tbody = New-Object System.Text.StringBuilder
foreach ($r in $findings) {
$pstate = if ($r.PowerState -eq 'PoweredOn') { '<span class="badge on">On</span>' } else { '<span class="badge off">Off</span>' }
[void]$tbody.AppendLine( ("<tr>" +
"<td>{0}</td>" + # Datacenter
"<td>{1}</td>" + # Cluster
"<td>{2}</td>" + # VM
"<td>{3}</td>" + # Power
"<td>{4}</td>" + # ControllerType
"<td>{5}</td>" + # Bus#
"<td>{6}</td>" + # BusSharing
"</tr>"
) -f (
(Escape-Html $r.Datacenter),
(Escape-Html $r.Cluster),
(Escape-Html $r.VM),
$pstate,
(Escape-Html $r.ControllerType),
(Escape-Html $r.BusNumber),
(Escape-Html $r.BusSharing)
))
}
# Cluster summary rows
$clusterRows = New-Object System.Text.StringBuilder
foreach ($c in $clusterAgg) {
[void]$clusterRows.AppendLine( ("<tr><td>{0}</td><td>{1}</td><td>{2}</td></tr>" -f (Escape-Html $c.Cluster), $c.VMs, $c.Findings) )
}
# HTML
$html = @"
<!doctype html>
<html lang="en">
<head>
<meta charset="utf-8">
<title>Shared SCSI Bus Report</title>
<meta name="viewport" content="width=device-width, initial-scale=1">
<style>$css</style>
</head>
<body>
<div class="panel">
<h1>Shared SCSI Bus Report</h1>
<h2>Generated: $($now) </h2>
<div class="grid" style="margin-top:12px;">
<div class="stat"><div><div class="label">Findings</div><div class="value" id="visibleCount">$totalFindings</div></div></div>
<div class="stat"><div><div class="label">Unique VMs</div><div class="value">$totalVMs</div></div></div>
<div class="stat"><div><div class="label">Clusters</div><div class="value">$totalClusters</div></div></div>
</div>
</div>
<div class="panel">
<h2>Filters</h2>
<div class="controls">
<input id="fCluster" type="text" placeholder="Filter by Cluster...">
<input id="fVM" type="text" placeholder="Filter by VM name...">
</div>
</div>
<div class="panel">
<h2>Cluster Summary</h2>
<div class="table-wrap">
<table>
<thead>
<tr><th>Cluster</th><th>Unique VMs</th><th>Findings</th></tr>
</thead>
<tbody>
$clusterRows
</tbody>
</table>
</div>
</div>
<div class="panel">
<h2>Detailed Findings</h2>
<div class="table-wrap">
<table>
<thead>
<tr>
<th>Datacenter</th>
<th>Cluster</th>
<th>VM</th>
<th>Power</th>
<th>ControllerType</th>
<th>Bus#</th>
<th>BusSharing</th>
</tr>
</thead>
<tbody>
$tbody
</tbody>
</table>
</div>
<div class="small">Click a column header to sort. Use filters above to narrow results.</div>
</div>
<script>$js</script>
</body>
</html>
"@
# Write HTML
try {
$fullPath = (Resolve-Path -Path $HtmlPath -ErrorAction SilentlyContinue)
if (-not $fullPath) {
$dir = Split-Path -Path $HtmlPath -Parent
if ($dir -and -not (Test-Path $dir)) { New-Item -ItemType Directory -Path $dir -Force | Out-Null }
$html | Out-File -FilePath $HtmlPath -Encoding UTF8
$fullPath = Resolve-Path -Path $HtmlPath
} else {
$html | Out-File -FilePath $fullPath -Encoding UTF8
}
Write-Host ("HTML report saved to: {0}" -f $fullPath.Path)
} catch {
Write-Warning ("Failed to write HTML to '{0}': {1}" -f $HtmlPath, $_.Exception.Message)
return
}
# --- Open in browser ---------------------------------------------------------
function Open-InBrowser {
param([string]$Path)
$candidates = @(
"$Env:ProgramFiles (x86)\Microsoft\Edge\Application\msedge.exe",
"$Env:ProgramFiles\Microsoft\Edge\Application\msedge.exe",
"$Env:LocalAppData\Microsoft\Edge\Application\msedge.exe",
"$Env:ProgramFiles\Google\Chrome\Application\chrome.exe",
"$Env:ProgramFiles (x86)\Google\Chrome\Application\chrome.exe",
"$Env:LocalAppData\Google\Chrome\Application\chrome.exe",
"$Env:ProgramFiles\Mozilla Firefox\firefox.exe",
"$Env:ProgramFiles (x86)\Mozilla Firefox\firefox.exe",
"$Env:LocalAppData\Mozilla Firefox\firefox.exe"
)
foreach ($exe in $candidates) {
if (Test-Path $exe) { Start-Process -FilePath $exe -ArgumentList ("`"{0}`"" -f $Path); return $true }
}
try { Start-Process $Path; return $true } catch { return $false }
}
$ok = Open-InBrowser -Path $fullPath.Path
if (-not $ok) { Write-Warning ("Could not open the report automatically. Please open: {0}" -f $fullPath.Path) }
Once the data is gathered, it generates a HTML report that provides a complete overview at a glance.
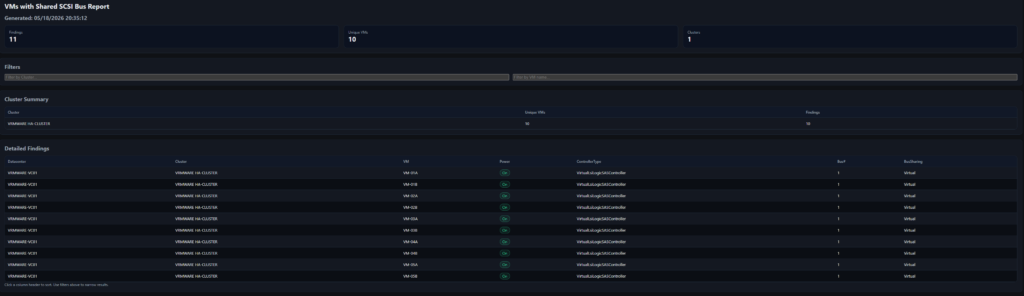
The script provides a clear, proactive, and repeatable way to identify VMs with Virtual SCSI Bus Sharing, preventing maintenance mode issues and keeping your ESXi patching process running smoothly.
This script is also available in my GitHub repositiry.