Total Host Power consumed per cluster in VCF Operations

In my previous blog post, Host Power consumed per hour in VCF Operations, we looked at how to create a custom Super Metric to accurately calculate and display hourly power consumption for individual ESXi hosts. While tracking power usage at the host level provides great granular data, many infrastructure teams and capacity planners need a broader perspective.

Goal:
Aggregate the power consumption of all hosts within a cluster and display this as a total cluster value in a view. Additionally, we want to be able to display the historical trend of the cluster’s power consumption in a graph.


In this follow-up post, we are going to take things a step higher. I will guide you through the process of aggregating this data to display the total power consumption per cluster. By rolling up our host-level metrics to the cluster object, you will be able to easily monitor, report, and analyze the energy footprint of your entire compute pools within VCF Operations. Let’s dive into how to set this up.

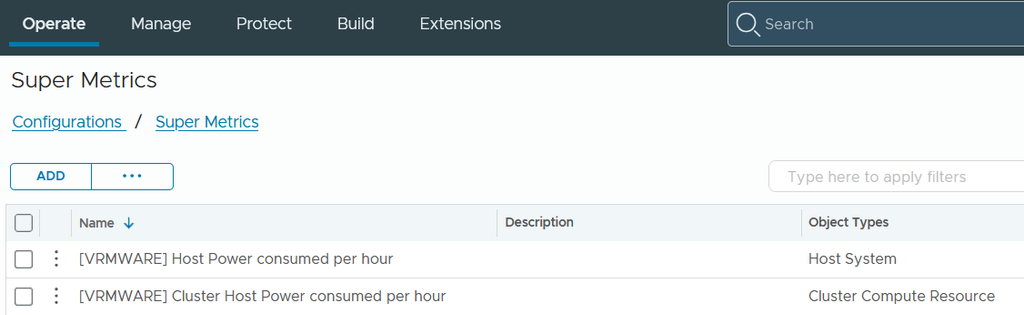
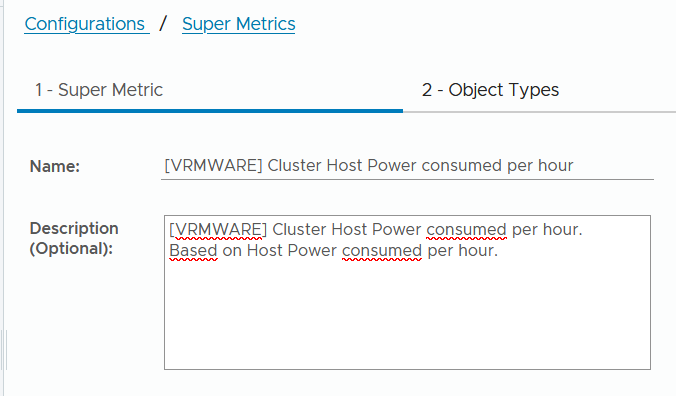
In the next image, we can see the Super Metric we created in the last blog post, Host Power consumed per hour and the new Super Metric Cluster Host Power consumed per hour. We will describe the steps for this latter one step-by-step.
The first part of the goal is aggregate the power consumption of all hosts within a cluster and display this as a total cluster value in a view. The key premises are:

  • Count all hosts in cluster
  • Use output Super Metric Host Power consumed per hour as input for the new Super Metric
  • Get the Super Metric ID of Host Power consumed per hour

You may not have heard of a Super Metric ID before. It allows you to reference an existing Super Metric and reuse it in a new one. I’ll show you where to find this ID in a moment, so you can reuse it.


In VCF Operations:

Administration > Configurations > Super Metrics Add
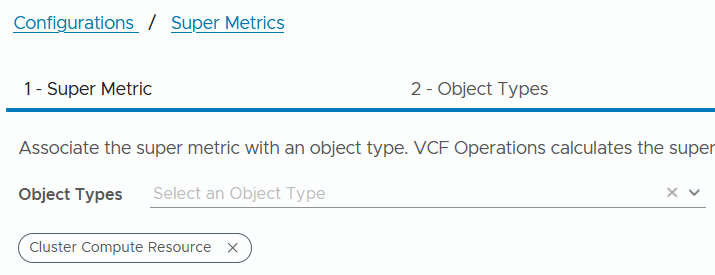
Select the object type Cluster Compute Resource
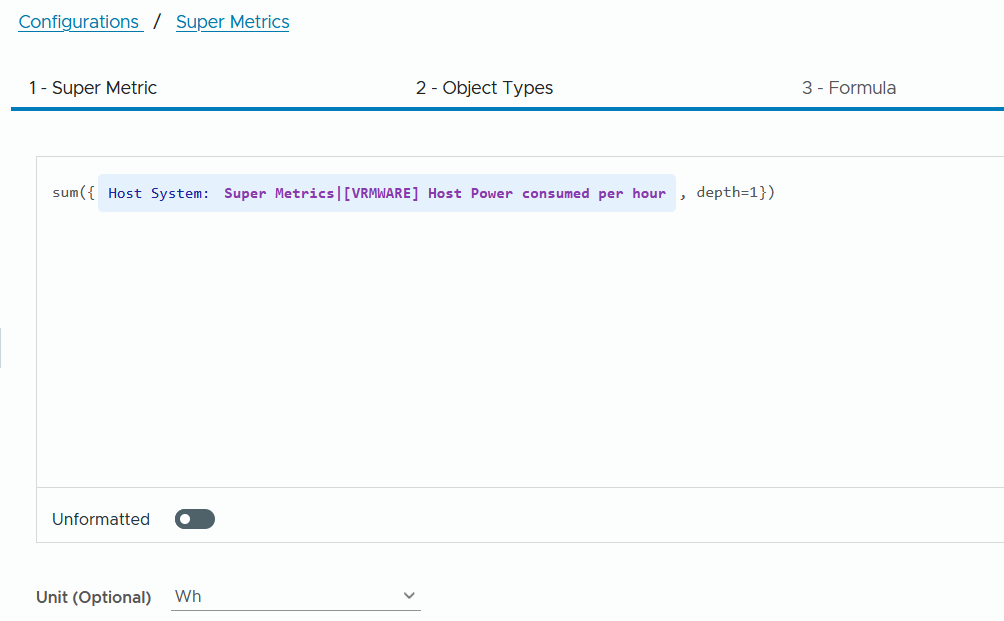
Formula (Formatted):

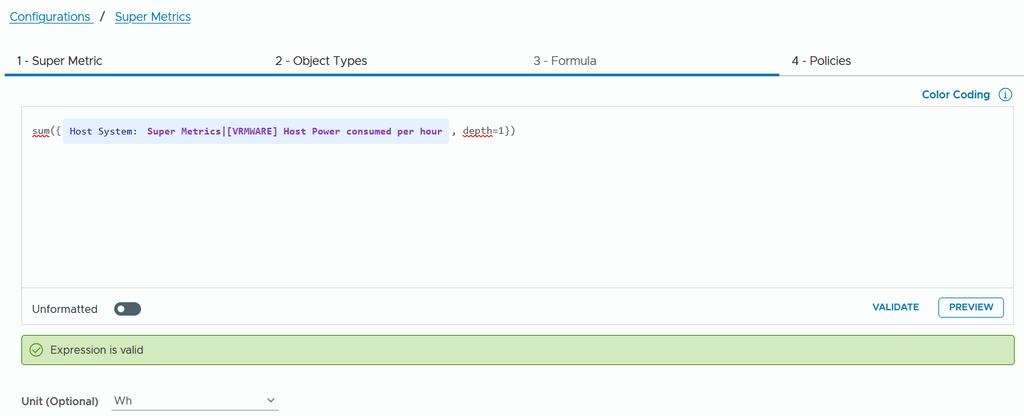
Here we see that the earlier created Super Metric Host Power consumed per hour is used as input. Depth=1 because we need to count all the hosts in the cluster.
In the next picture we show the unformatted formula.

Formula (Unformatted):

sum(${adaptertype=VMWARE, objecttype=HostSystem, metric=Super Metric|sm_3291c309-db82-46c3-947f-9bc93d6e5b22, depth=1}).

Unit (Optional) Wh

Once we’rรฉ done with creating this Super Metric, I’ll show you an example of how to retrieve the Super Metric ID.
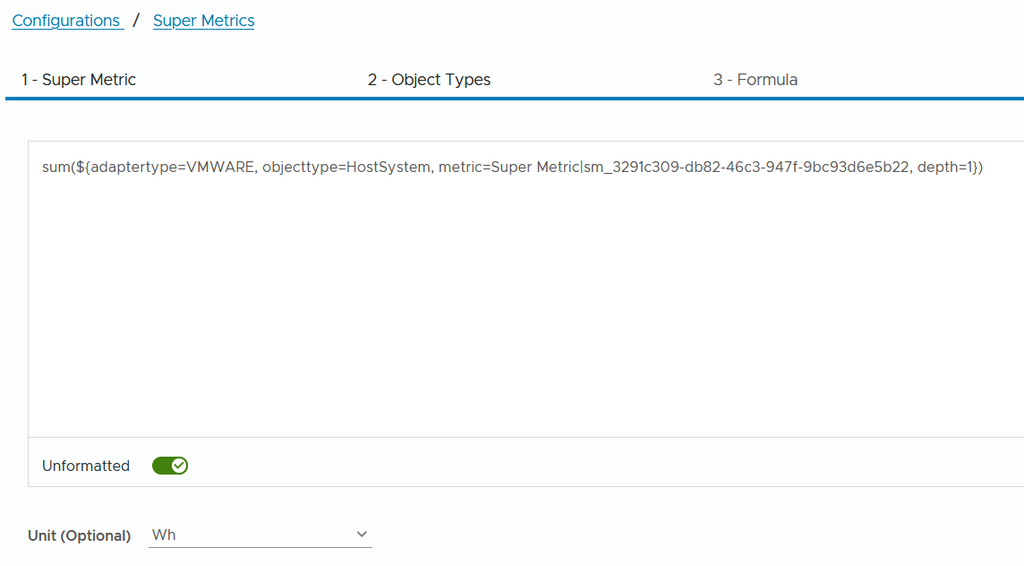
When we move the Unformatted button back to the left we see the Super Metric as displayed in the next screenshot.

Validate the formula
Preview the formula.

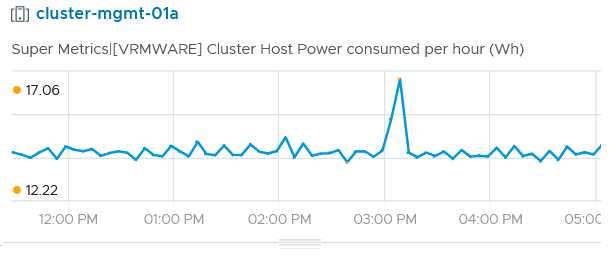
In the following example, we see the cluster host’s power consumption per hour. If you need an overview of the historical trend later, you can use the trend widget. The information displayed looks like the preview example below.
Policies

Mark a policy. In my lab there only the default policy. So we continue and hit the Create button.

The Super Metric is now created

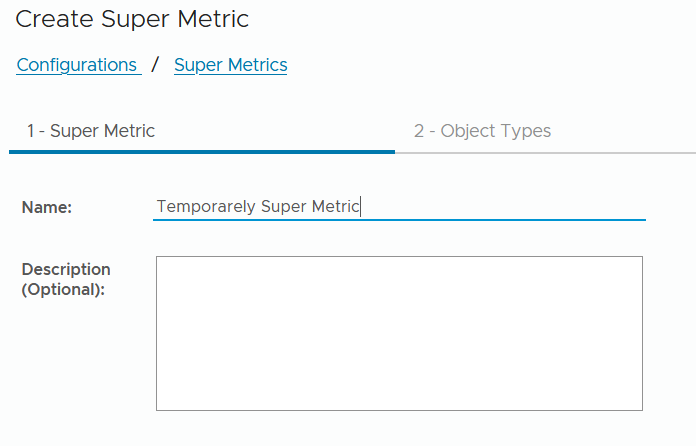
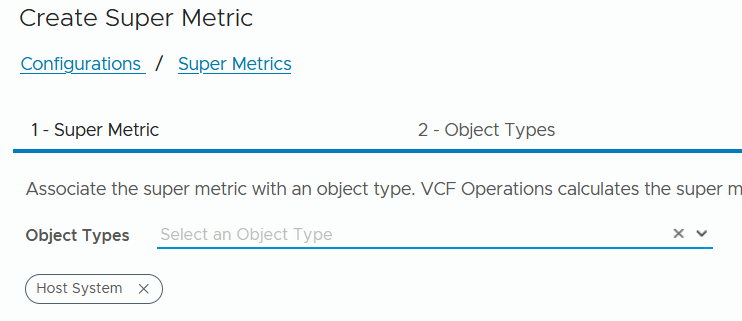
To find a Super Metric ID, a way is to temporarily create a new Super Metric. Choose the same object type as the one used in Super Metric “Host Power consumed per hour“.

Creation of temporarely Super Metric to extract the Super Metric ID

Administration > Configurations > Super Metrics Add

Step 1. Super Metric
Step 2. Select Object type
3. Step 3. Formula (Formatted)

This > Metric > Type “Super” and select the Super Metric Host Power consumed per hour. The result is displayed in the next picture.
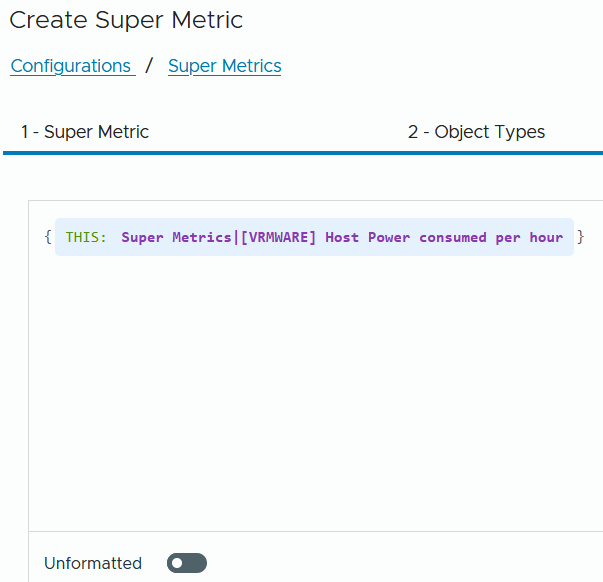
If we move the Unformatted button to the right we see the following unformatted Super Metric code:

${this, metric=Super Metric|sm_3291c309-db82-46c3-947f-9bc93d6e5b22}
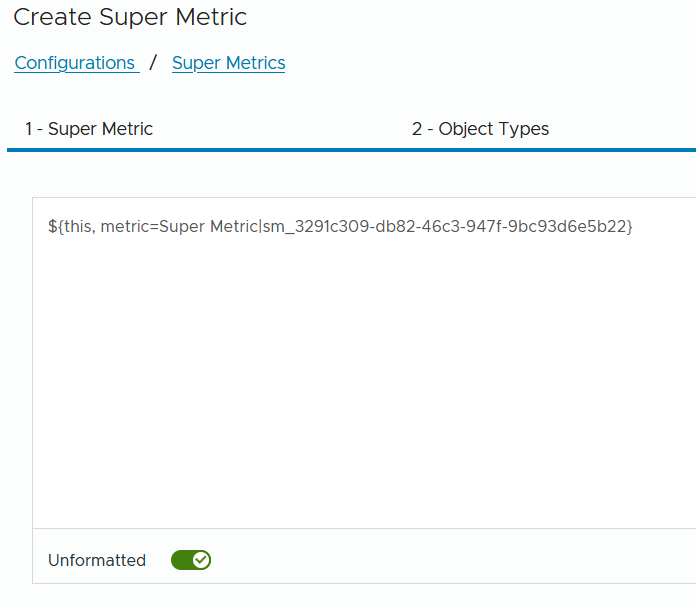
Here we see the Super Metric ID sm_3291c309-db82-46c3-947f-9bc93d6e5b22. This is the ID we need to copy and paste into the new Super Metric cluster โ€œHost Power consumed per hourโ€ that we created. After youโ€™ve copied the Super Metric ID, you can cancel the creation of this temporary Super Metric. You donโ€™t need to save it, but feel free to do so if you think you might need it again.

To clarify, here is the unformatted formula of the new Super Metric Cluster Host Power consumed per hour.

sum(${adaptertype=VMWARE, objecttype=HostSystem, metric=Super Metric|sm_3291c309-db82-46c3-947f-9bc93d6e5b22, depth=1})

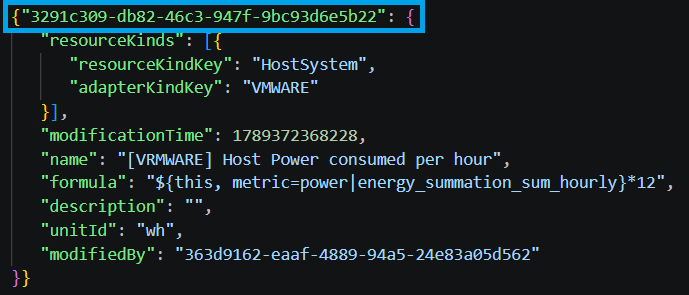
Another way to find the Super Metric ID is to export the Super Metric to a file and open that file. You’ll see the Super Metric ID on the first line.
I hope this blog post helps you gain clearer daily and historical insights into your environmentโ€™s total host power consumption per cluster in VCF Operations.

Host Power consumed per hour in VCF Operations

If you have ever worked with VCF Operations, you might have noticed a discrepancy in the power consumption readings compared to out-of-band management interfaces like Dell iDRAC. This difference occurs because VCF Operations displays power consumption in 5-minute cycles, whereas Dell iDRAC aggregates this data hourly. To align these metrics and display hourly power consumption within VCF Operations, a custom Super Metric must be created. In this blog post, I will guide you step-by-step through the process of setting up this Super Metric to ensure consistent and accurate energy reporting across your environment.


In the following example we create a new Super Metric named [VRMWARE] Host Power consumed per hour. This Super Metric multiply the metric Total Energy Consumed in the collection period (Wh) with 12. Assume that the default collection cycle of 5 minutes is used. This way, you can display the current power on an hourly basis instead of the standard current per 5-minute cycle.

This example is created in a VCF 9.1.1 environment. It also works fine in Aria Operations 8.18.x. Be aware that in Aria Operations, Configurations can be find under Operations. Let’s start with building the new Super Metric.

In VCF Operations:

Administration > Configurations > Super Metrics Add

Select the object type Host System

Formula (Unformatted):

If we move the Unformatted button to the right we can copy the following unformatted Super Metric code:

${this, metric=power|energy_summation_sum_hourly}*12

Unit (Optional) Wh

When we move the Unformatted button back to the left we see the Super Metric as displayed in the next screenshot.

Validate the formula

Preview the formula.

In the next example screenshot is power 0 Wh because of this is a nested ESXi server in the lab.

Policies

Mark a policy. In my lab there only the default policy. So we continue and hit the Create button.

The Super Metric is now created

Now also we want to include the Super Metric in a host list view. To do this, we clone the ESXi Inventory view. It can be found under Dashboards > Views > Manage > Filter on ESXi Basic.

In this example we rename the cloned view to [VRMWARE] ESXi Basic Inventory and add the Super Metric to metrics list and renamed the Metric Label in Host Power consumption per hour.

Finally we add a Summary so the total power of all listed hosts in the view are counted. In the Configuration window select Sum as Aggregation.

The new cloned view is visible in the filtered Views list.

If we open the view see the Column with Host Power consumption per hour. Since we added the โ€œTotalโ€ summary to the view, we can see the total power usage of all servers in the list.

The Super Metric collected data is also usable as historical data and available in graph form as well.

I hope this blog post helps you gain clearer daily and historical insights into your environment’s host power consumption.

Monitoring datastores under /mnt in Linux with VCF Operations Telegraf agent

Recently, I have spent a lot of time monitoring Linux servers with the Telegraf agent in VCF Operations. This includes metrics such as /boot, /var, /var/log, etc. This was fairly easy to implement. However, I also wanted to be able to monitor datastores under /mnt. It turned out that these metrics are not available by default after installing the Telegraf agent.

Objective: Raise an alert when a datastore under /mnt exceeds 75% capacity.

After installing the Telegraf agent on a Linux server, the following directory was created: /opt/vmware. In this directory, I created the following bash script: pct_used.sh. Please note that a script is executed from Telegraf using the system account arcuser. The arcuser account must have read and execute permissions for the script. Set the permissions using the following command:

chmod 755 /opt/vmware/pct_used.sh

The script below is a generic script for reading the % used from the datastores under /mnt. By providing the correct arguments you will receive a value (Use%) that you can use as a metric in VCF Operations as input for the alert. In the following examples:

  • store1 = Linux Server
  • 001 = Datastore 001
  • 002 = Datastore 002

Examples:
root@vrmware001:/opt/vmware# ./pct_used.sh /mnt/store1/001
Result: 70

root@vrmware001:/opt/vmware# ./pct_used.sh /mnt/store1/002
Result: 64

Please note that the system account arcuser also has read + execute permissions on the /mnt and /mnt/server directory. In the examples mentioned above, this means that these rights must be located on /mnt/store1. Here’s how to do it.

  • chmod 755 /mnt
  • chmod 755 /mnt/store1

With the next command you can check if the arcuser account have permissions the read the datastores.

sudo -u arcuser df -P /mnt/store1/001 where /mnt/store1/001 should be replaced with your own datastore path.

#!/usr/bin/env bash
# Usage: ./pct_used.sh /mnt/store1/001

set -euo pipefail

MOUNT_PATH="${1:-}"

# Check if argument is provided
if [[ -z "$MOUNT_PATH" ]]; then
  echo "Usage: $0 <mount_path>" >&2
  exit 2
fi

# Check if argument is provided
if [[ ! -d "$MOUNT_PATH" ]]; then
  echo "Path not found: $MOUNT_PATH" >&2
  exit 3
fi

# Get percentage used via df; NR==2 = the data row
# +0 forces numeric output (strips '%')
pct_used="$(df -P "$MOUNT_PATH" 2>/dev/null | awk 'NR==2{print $5+0}')"

# Validate: empty or not numeric?
if [[ -z "$pct_used" || ! "$pct_used" =~ ^[0-9]+$ ]]; then
  echo "Unable to read usage for: $MOUNT_PATH" >&2
  exit 4
fi

# Output only the number to stdout (for Telegraf)
echo "$pct_used"

Now the script must be launched from VCF Operations.

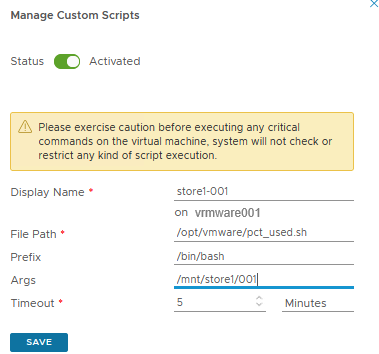
Go to Manage Telegraf Agents section, select your favourite Linux server and add a Custom Script.

If the custom script is configured correctly, the first data should arrive after 5 to 10 minutes. You can see one of the following two statuses at the Telegraf agent.

This means that the data is being received.

This means that the data has not changed since the previous measurement point.

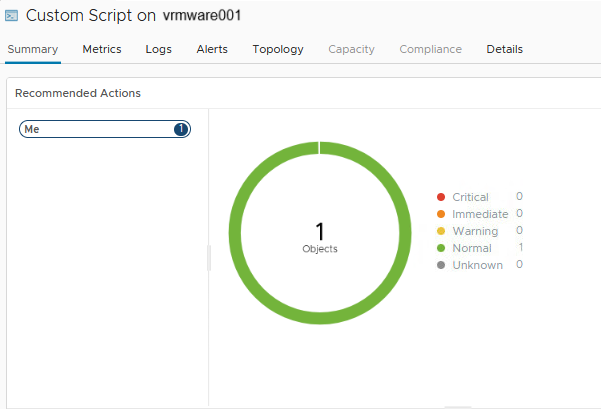
Go to the inventory view of the Linux server and select Custom Script. Check if the status is Normal (green).

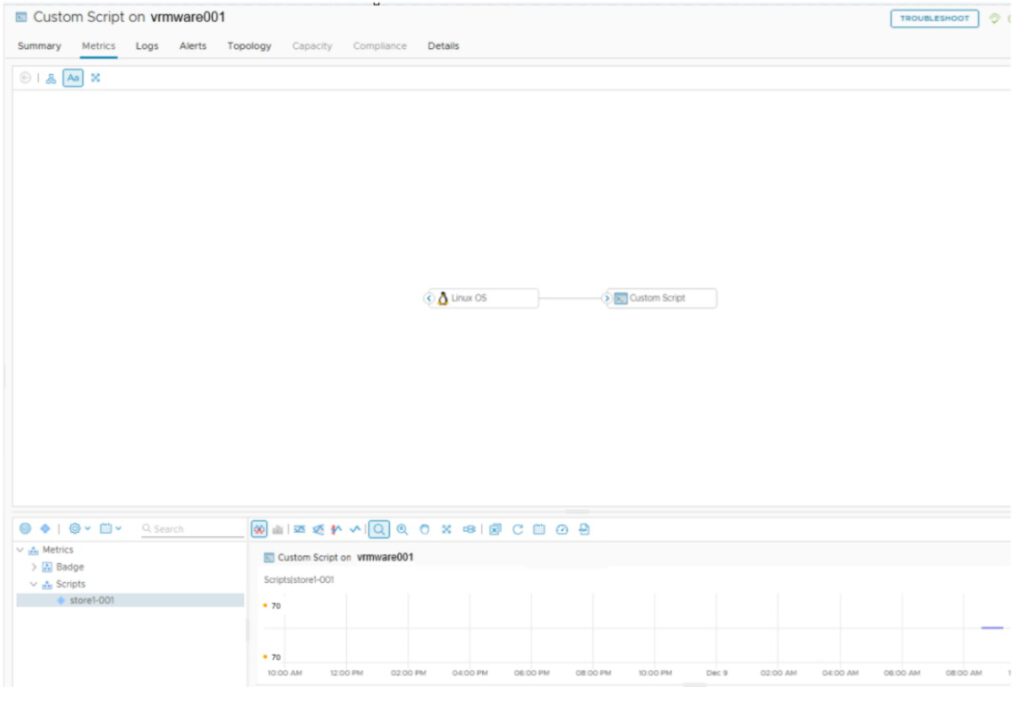
If the status is normal, go to the Metrics tab, Metrics, Scripts, Custom Script (store1-001). Double click on the Custom Script and there is the Metric value.

With these metrics, we can now create alerts (Use%) for datastores on Linux servers mounted under /mnt.

I tested it in my lab on both Aria Operations 8.18.5 and VCF Operations 9.0.1. It works on both versions.