
In my previous blog post, Host Power consumed per hour in VCF Operations, we looked at how to create a custom Super Metric to accurately calculate and display hourly power consumption for individual ESXi hosts. While tracking power usage at the host level provides great granular data, many infrastructure teams and capacity planners need a broader perspective.
Goal:
Aggregate the power consumption of all hosts within a cluster and display this as a total cluster value in a view. Additionally, we want to be able to display the historical trend of the cluster’s power consumption in a graph.

In this follow-up post, we are going to take things a step higher. I will guide you through the process of aggregating this data to display the total power consumption per cluster. By rolling up our host-level metrics to the cluster object, you will be able to easily monitor, report, and analyze the energy footprint of your entire compute pools within VCF Operations. Let’s dive into how to set this up.
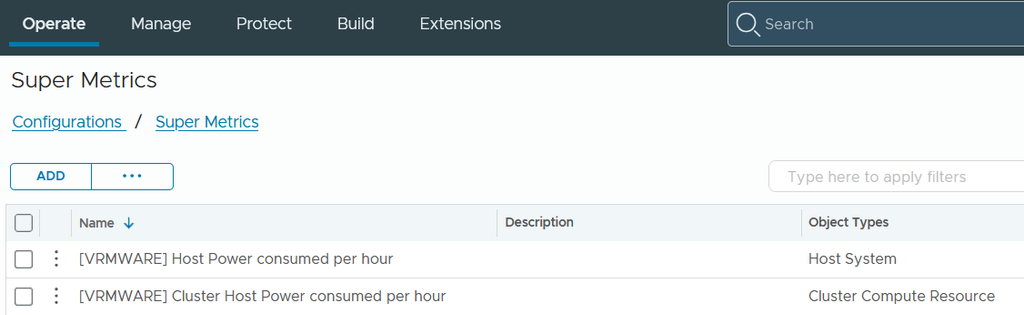
In the next image, we can see the Super Metric we created in the last blog post, Host Power consumed per hour and the new Super Metric Cluster Host Power consumed per hour. We will describe the steps for this latter one step-by-step.
The first part of the goal is aggregate the power consumption of all hosts within a cluster and display this as a total cluster value in a view. The key premises are:
- Count all hosts in cluster
- Use output Super Metric Host Power consumed per hour as input for the new Super Metric
- Get the Super Metric ID of Host Power consumed per hour
You may not have heard of a Super Metric ID before. It allows you to reference an existing Super Metric and reuse it in a new one. I’ll show you where to find this ID in a moment, so you can reuse it.
In VCF Operations:
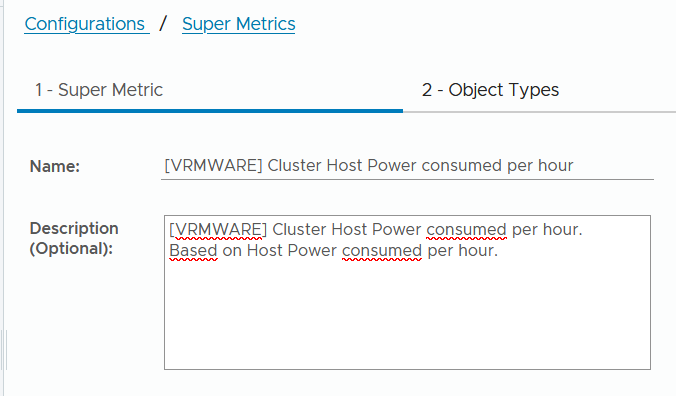
Administration > Configurations > Super Metrics Add
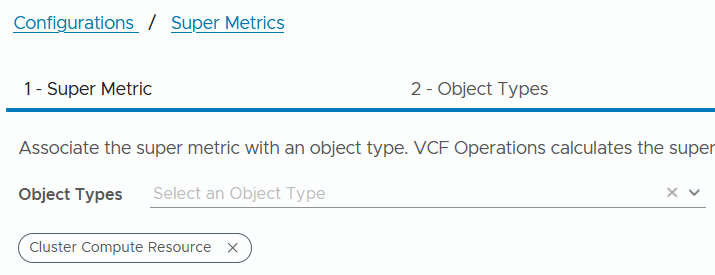
Select the object type Cluster Compute Resource
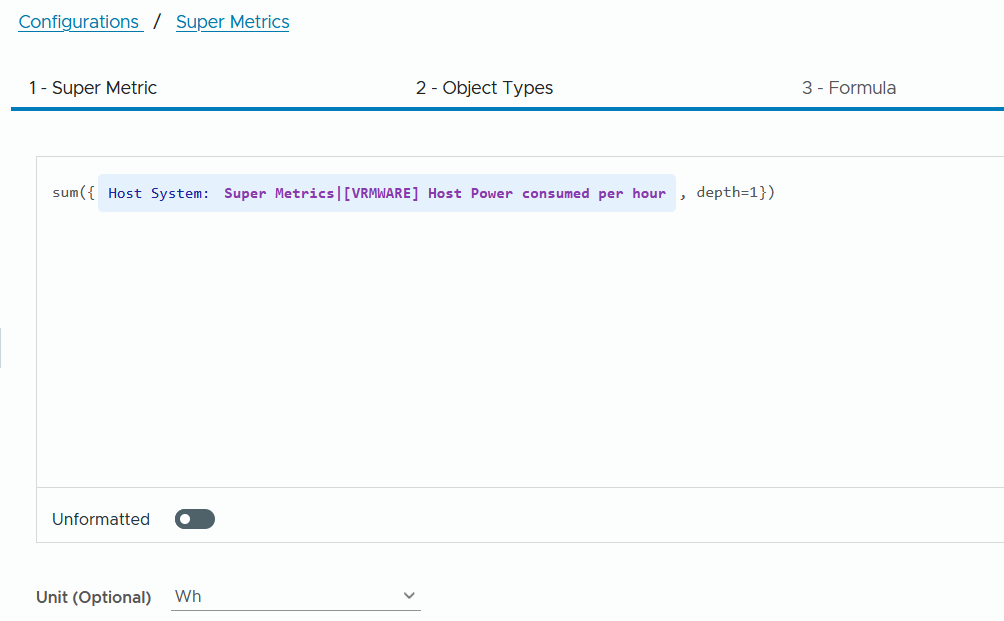
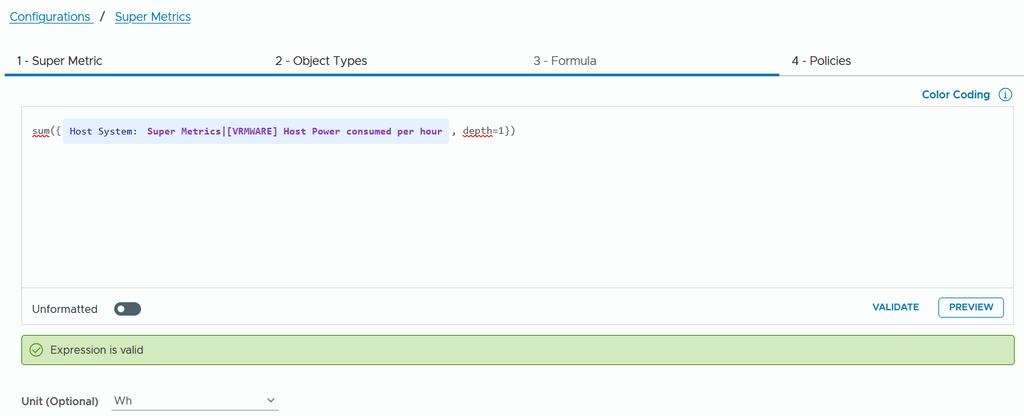
Formula (Formatted):
Here we see that the earlier created Super Metric Host Power consumed per hour is used as input. Depth=1 because we need to count all the hosts in the cluster.
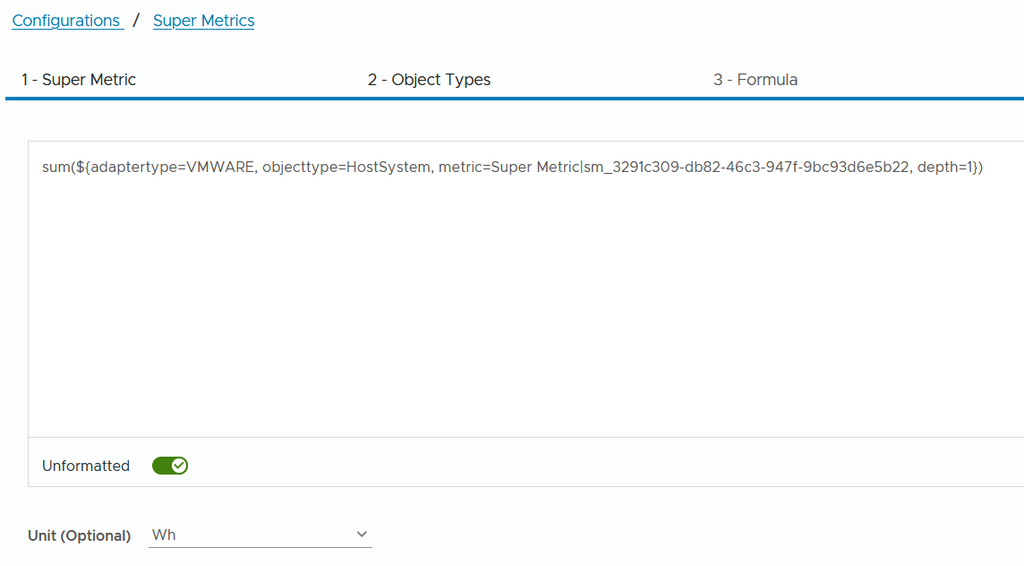
In the next picture we show the unformatted formula.
Formula (Unformatted):
sum(${adaptertype=VMWARE, objecttype=HostSystem, metric=Super Metric|sm_3291c309-db82-46c3-947f-9bc93d6e5b22, depth=1}).
Unit (Optional) Wh
Once we’ré done with creating this Super Metric, I’ll show you an example of how to retrieve the Super Metric ID.
When we move the Unformatted button back to the left we see the Super Metric as displayed in the next screenshot.
Validate the formula
Preview the formula.
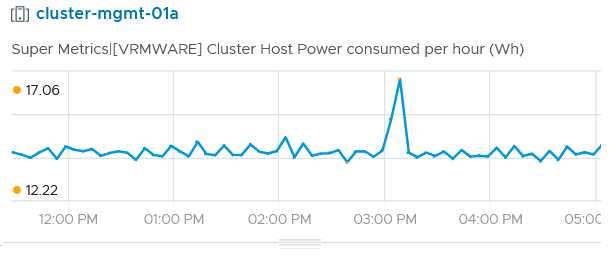
In the following example, we see the cluster host’s power consumption per hour. If you need an overview of the historical trend later, you can use the trend widget. The information displayed looks like the preview example below.
Policies
Mark a policy. In my lab there only the default policy. So we continue and hit the Create button.

The Super Metric is now created
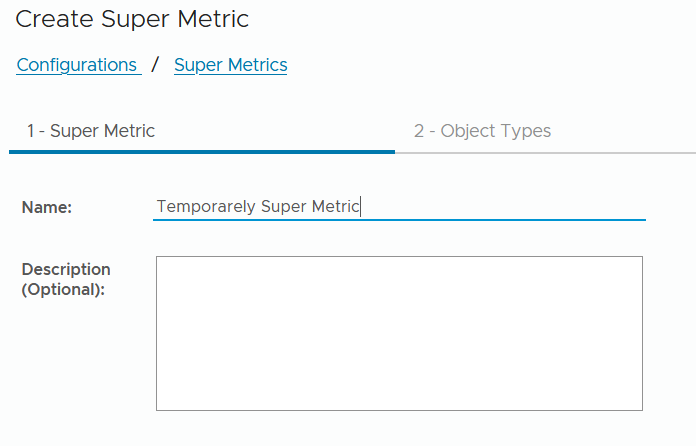
To find a Super Metric ID, a way is to temporarily create a new Super Metric. Choose the same object type as the one used in Super Metric “Host Power consumed per hour“.
Creation of temporarely Super Metric to extract the Super Metric ID
Administration > Configurations > Super Metrics Add
Step 1. Super Metric
Step 2. Select Object type
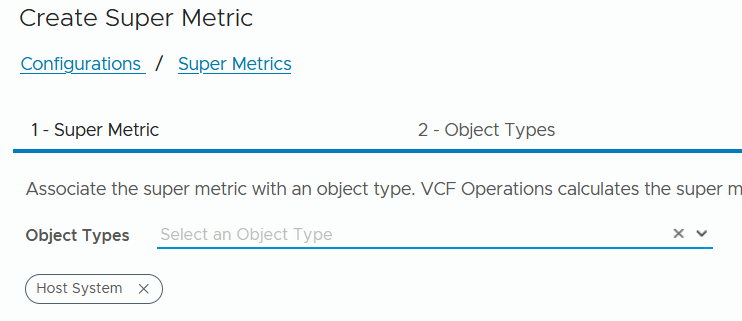
3. Step 3. Formula (Formatted)
This > Metric > Type “Super” and select the Super Metric Host Power consumed per hour. The result is displayed in the next picture.
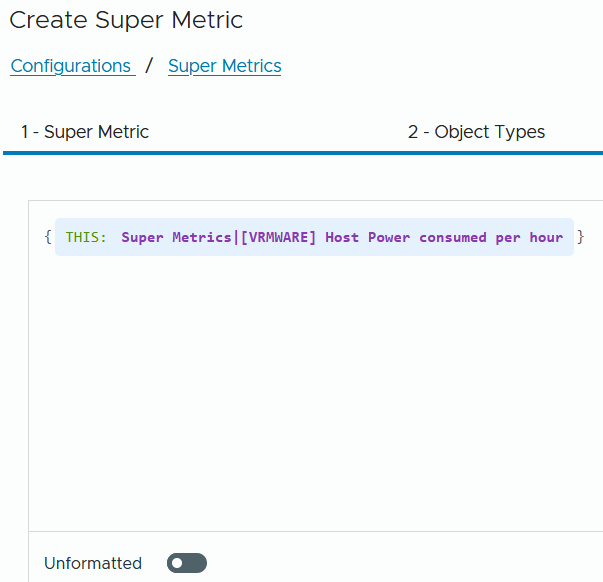
If we move the Unformatted button to the right we see the following unformatted Super Metric code:
${this, metric=Super Metric|sm_3291c309-db82-46c3-947f-9bc93d6e5b22}
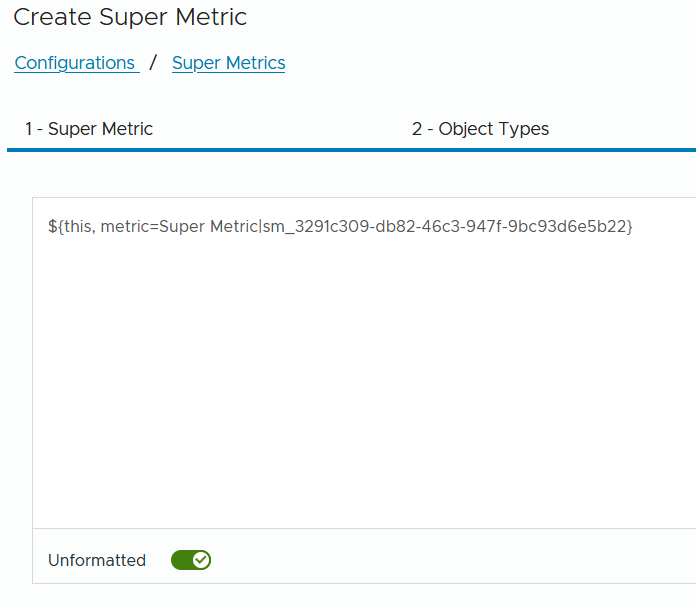
Here we see the Super Metric ID sm_3291c309-db82-46c3-947f-9bc93d6e5b22. This is the ID we need to copy and paste into the new Super Metric cluster “Host Power consumed per hour” that we created. After you’ve copied the Super Metric ID, you can cancel the creation of this temporary Super Metric. You don’t need to save it, but feel free to do so if you think you might need it again.
To clarify, here is the unformatted formula of the new Super Metric Cluster Host Power consumed per hour.
sum(${adaptertype=VMWARE, objecttype=HostSystem, metric=Super Metric|sm_3291c309-db82-46c3-947f-9bc93d6e5b22, depth=1})
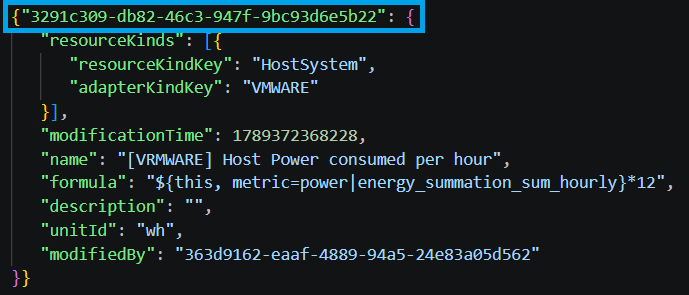
Another way to find the Super Metric ID is to export the Super Metric to a file and open that file. You’ll see the Super Metric ID on the first line.
I hope this blog post helps you gain clearer daily and historical insights into your environment’s total host power consumption per cluster in VCF Operations.