This blog is meant to keep up to date on important infrastructure alerts during and outside office hours with standard products such as VMware Aria Operations for Logs (AO4L) and Microsoft (MS)Teams.
Use Case – Increase the ability to notice prio 1 alerts outside of office hours with the available technical resources.
Goal – In addition to the standard AO4L alerts, we also want to have the option available to receive alerts through Microsoft Teams.
Solution – Use AO4L Webhook to send alerts to MS Teams
Setup – In order to have AO4L alerts sent to MS Teams, we need to set up two things.
- Setup a MS Teams Connector to receive alerts
- Setup the AO4L Webhook configuration to push alerts
Setup a MS Teams Connector to receive alerts
First, decide in which Teams Channel you want to receive the AO4L alerts or add a new Teams Channel. I have created a new Channel called VRMware VMware Alerts.

Click on the 3 dots on the right side and select Manage Channel.
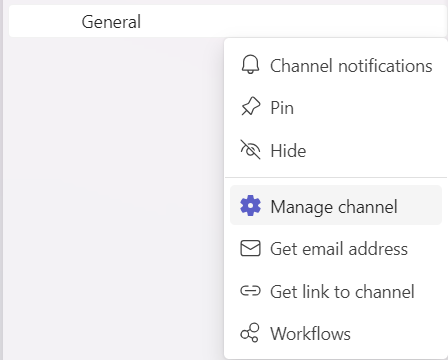
Select Edit under Connectors.
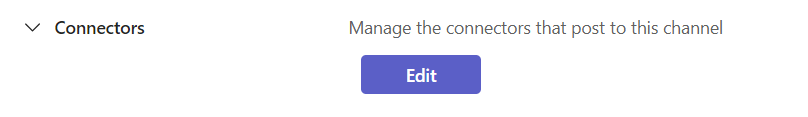
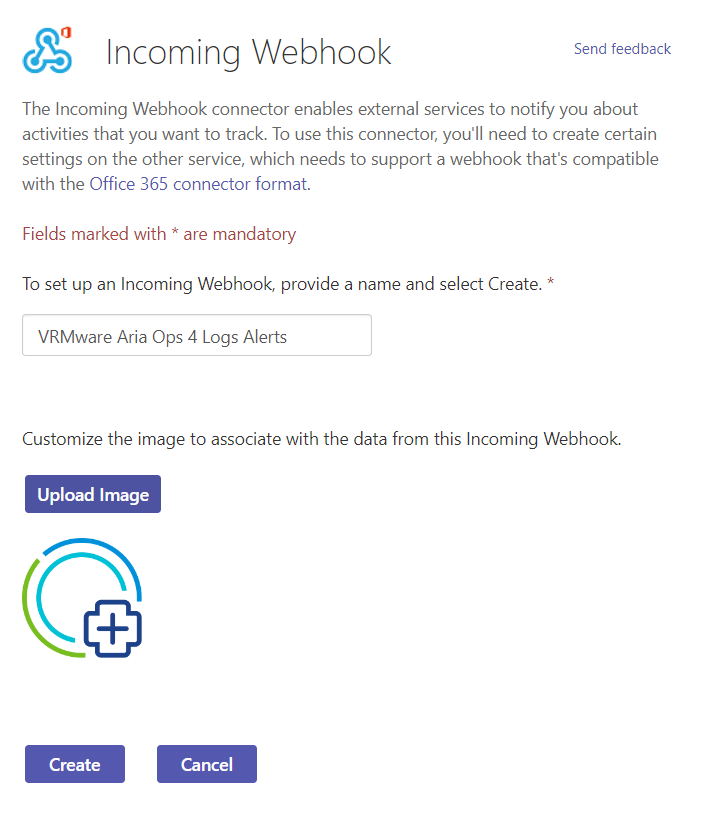
Select Incoming Webhook and hit the Configure button.

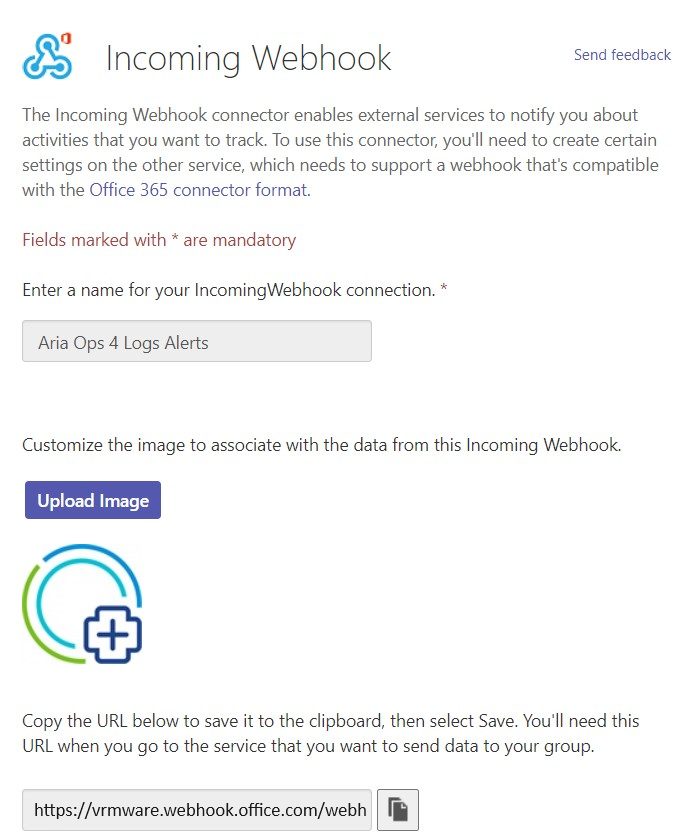
Provide a friendly name, upload an image and create the connector.
After creation copy the url to the clipboard. We need this URL later to configure the AO4L Webhook.
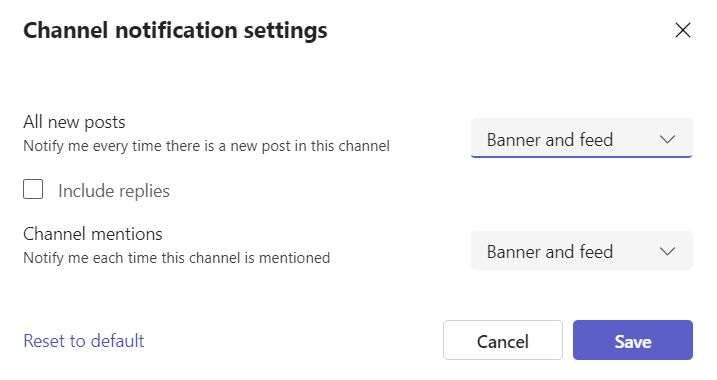
Before we move on to AO4L we need to enable the channel notifications. Click once again on the 3 dots on the right side and select Channel notifications > All New Posts.
Setup the AO4L Webhook configuration to push alerts
Go to the Administration section and open Configuration > Webhook > New Webhook. Choose a name. From the Endpoint drop down menu select Custom. Copy the Webhook URL that was copied from MS Teams connector. From the Content Type drop down menu select JSON and from the Action drop down menu select POST. The Webhook Payload will be described under the picture.
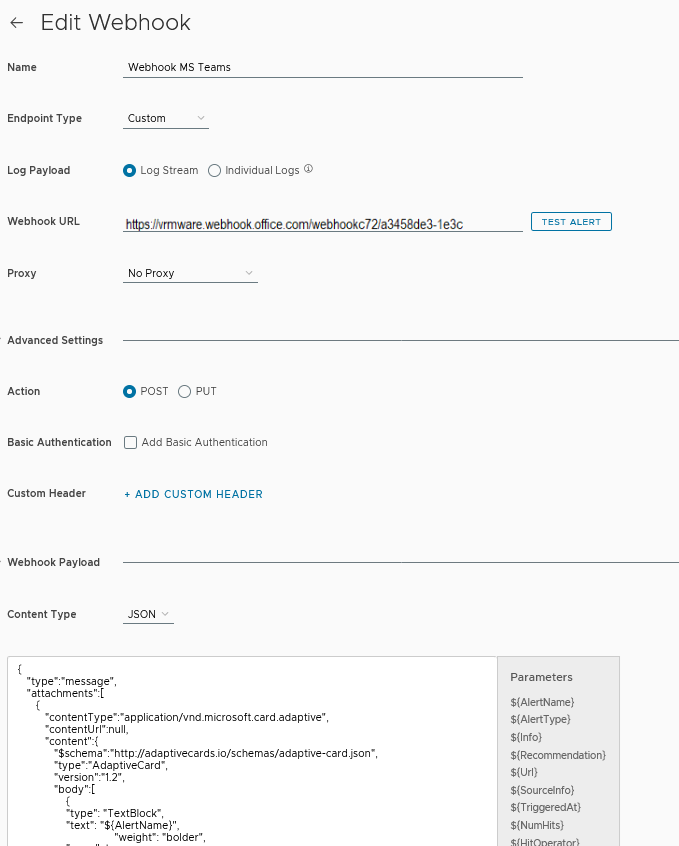
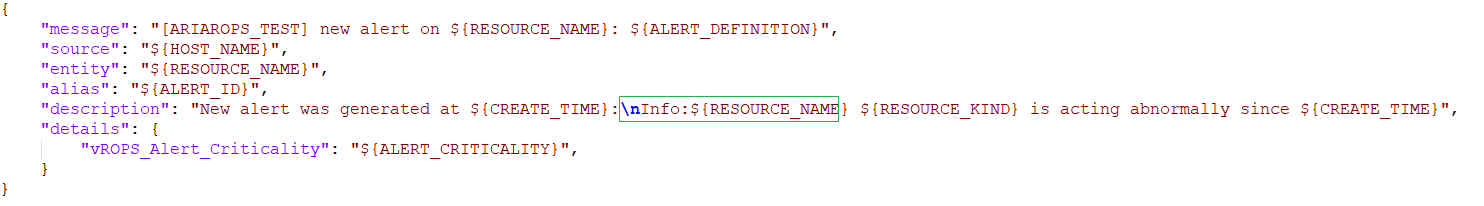
Webload Payload
The Webload Payload was the hardest part to figuring it out how the Webhook Payload layout should look like.
As far as I know from AO4L Webhook, only clear text can be used to send notifications to MS Teams. It’s possible to use one or more parameters in the script. For an overview of the parameters see the picture above here. Because the notictions are send in clear text it’s not possible to use all parameters. In our case not a problem because MS Teams is not used to replace monitoring software. It is just an additional option to be informed in a timely manner.
I wouldn’t go indepth how I found out the layout of the Webhook Payload code. That’s why I’m only sharing the code with you, so you can start testing for yourself.
{
   "type":"message",
   "attachments":[
      {
         "contentType":"application/vnd.microsoft.card.adaptive",
         "contentUrl":null,
         "content":{
            "$schema":"http://adaptivecards.io/schemas/adaptive-card.json",
            "type":"AdaptiveCard",
            "version":"1.2",
            "body":[
                {
                "type": "TextBlock",
                "text": "${AlertName}",
				"weight": "bolder",
                "wrap": true
                }
            ]
         }
      }
   ]
}
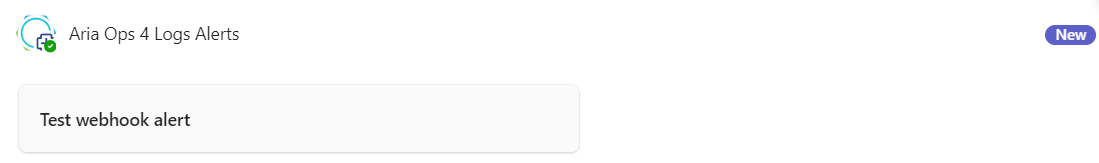
After completing the Webhook configuration you may want test the Webhook configartion. Press the Send Test button

Finally Save the Webhook configuration.
Open the MS Teams Channel where the connector was created earlier. You should see here the Test Alert.
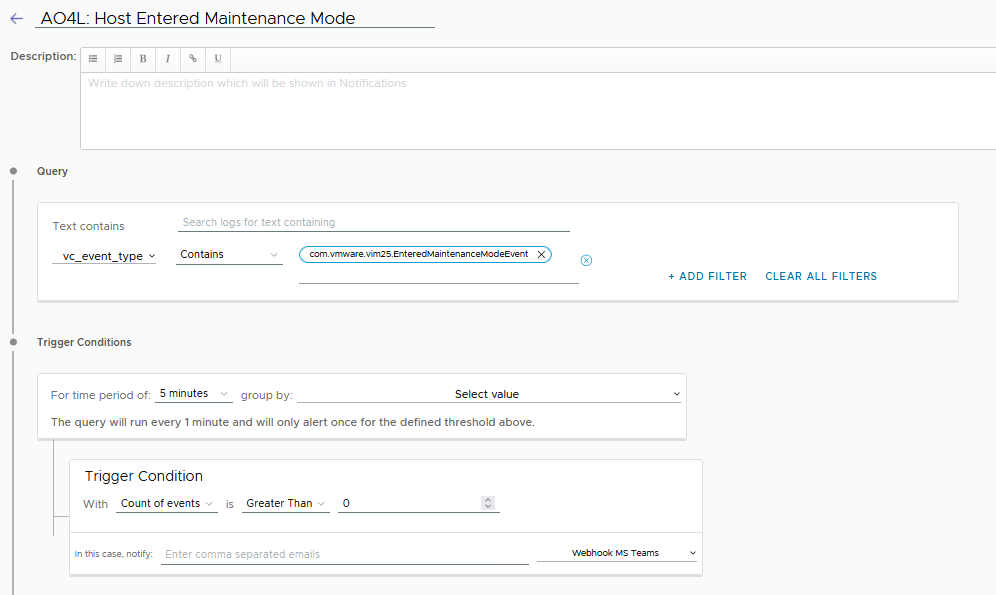
The last part is sending a notification to MS Teams when a ESXi host have entered Maintenance Mode.
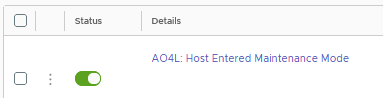
I have created an AO4L alert with the name “AO4L Alert: Host entered Maintenance Mode“.
I have decided that I would like to be notified by MS Teams. This can be set under the Trigger Conditions.
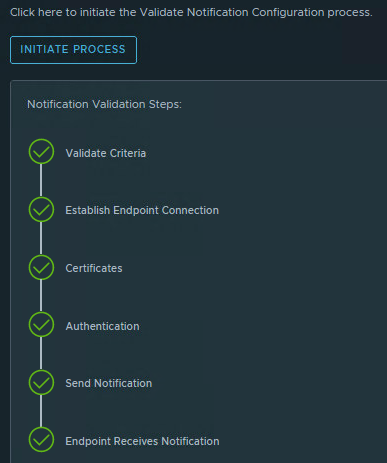
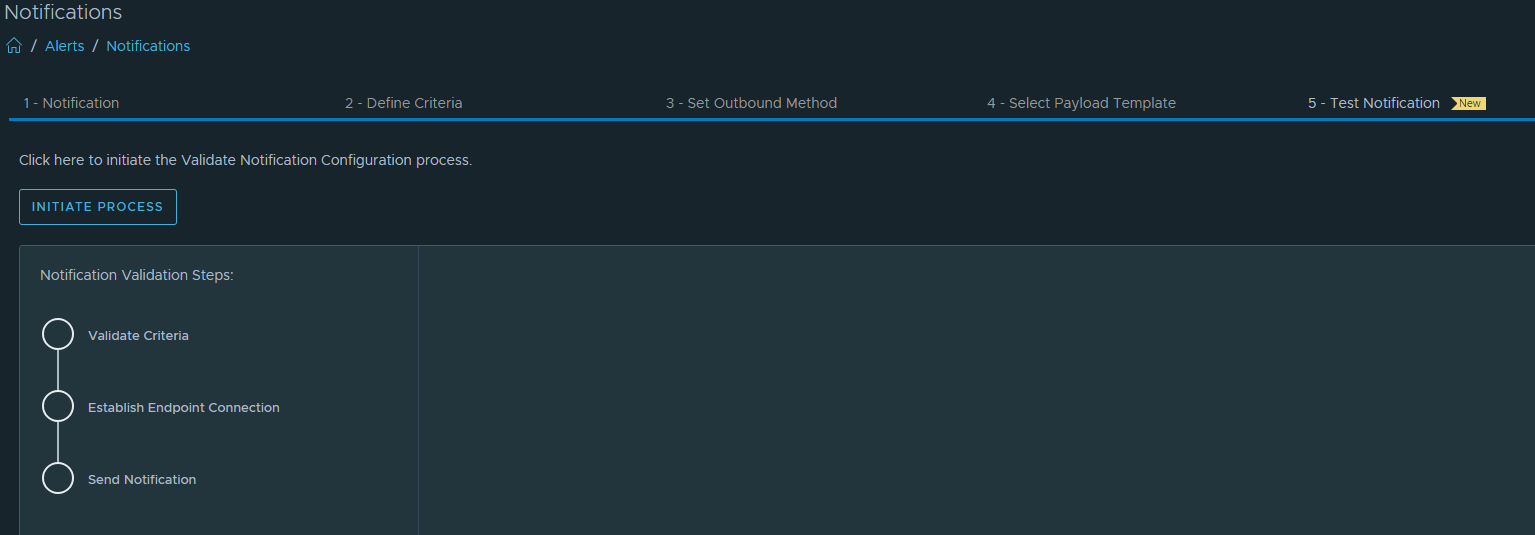
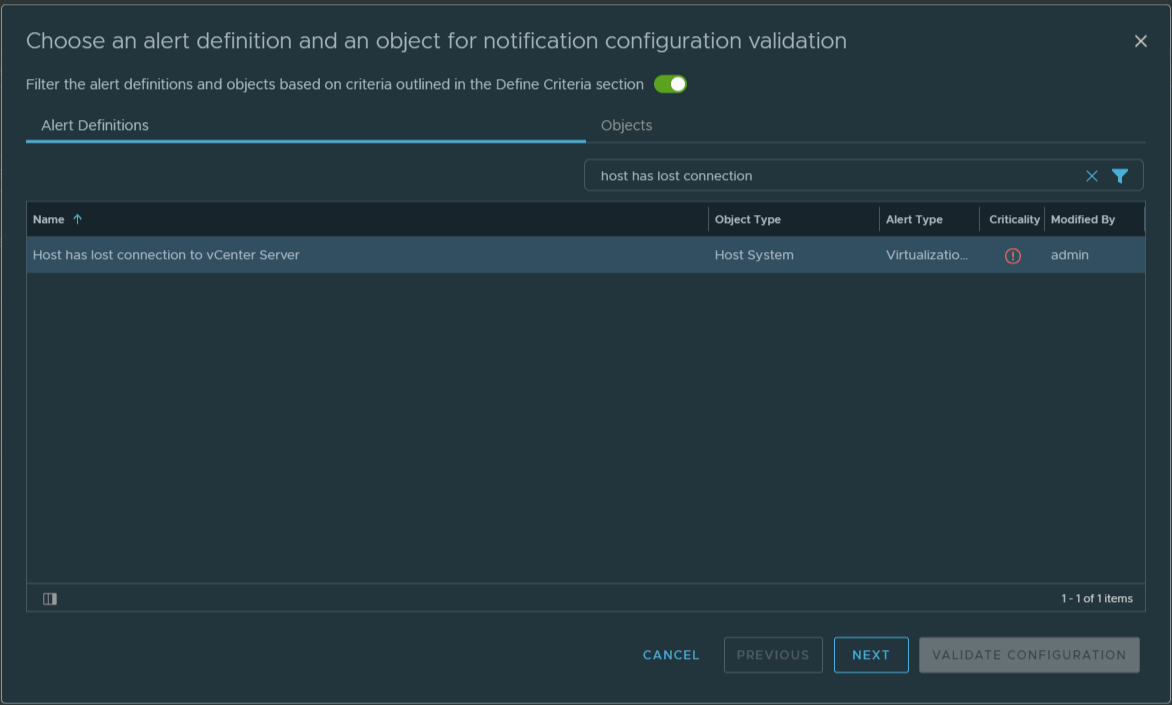
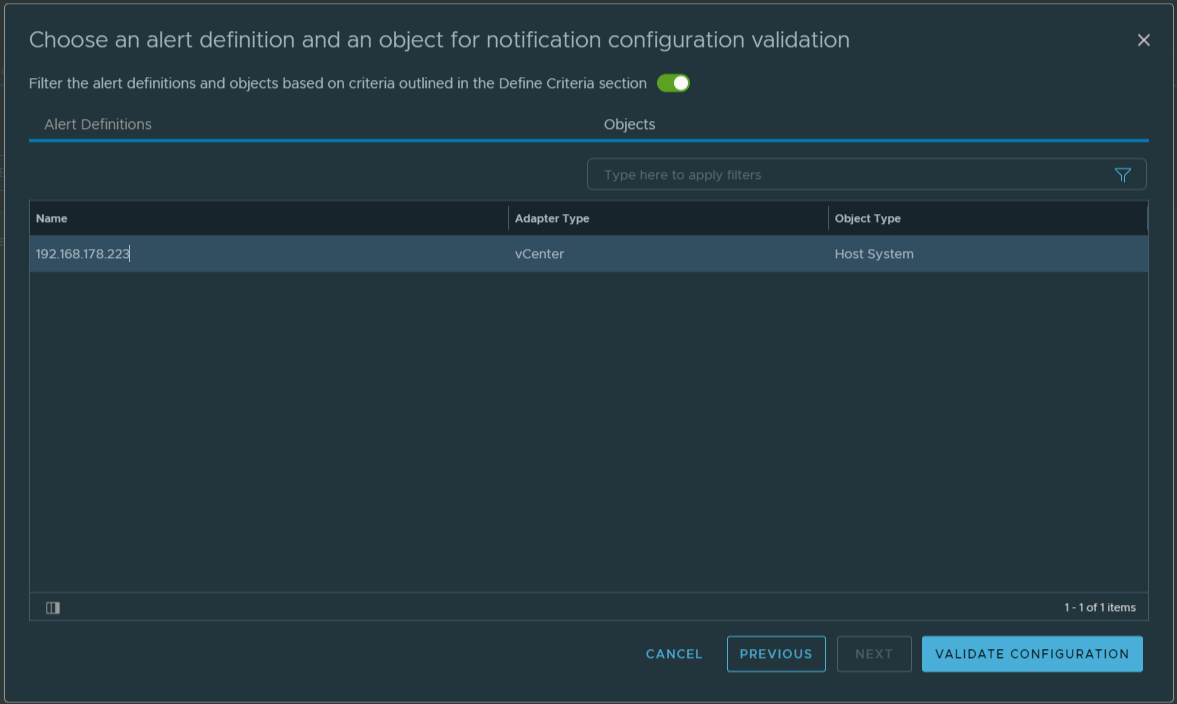
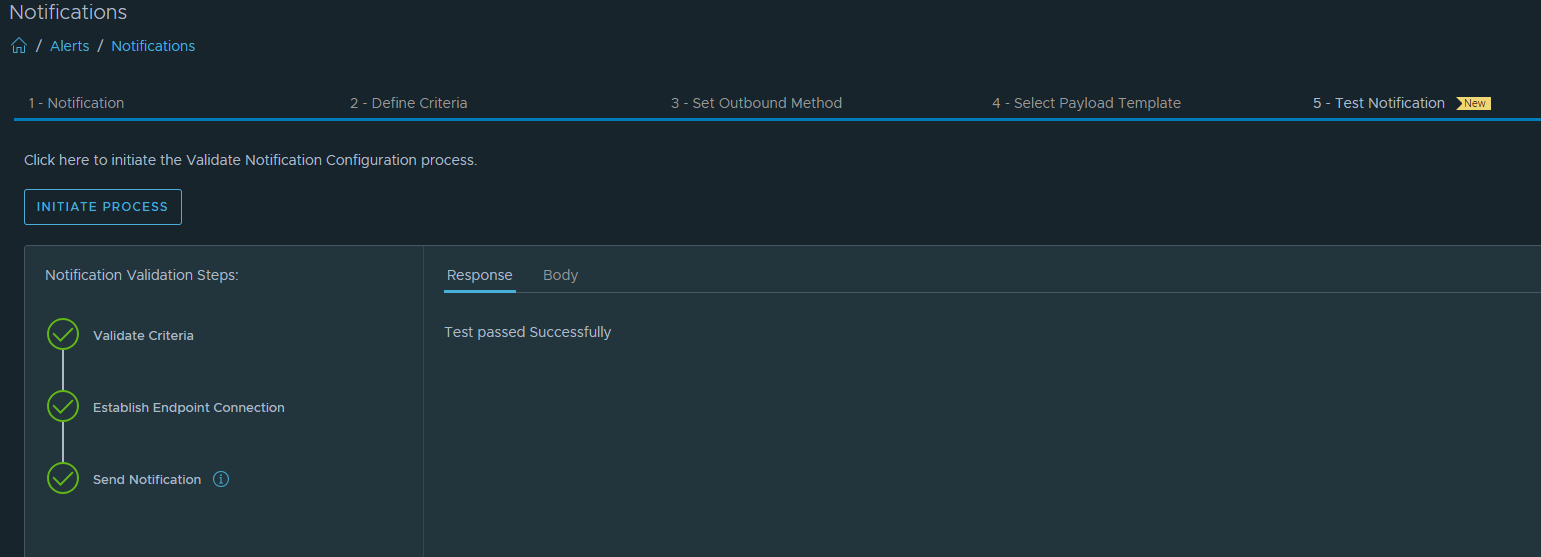
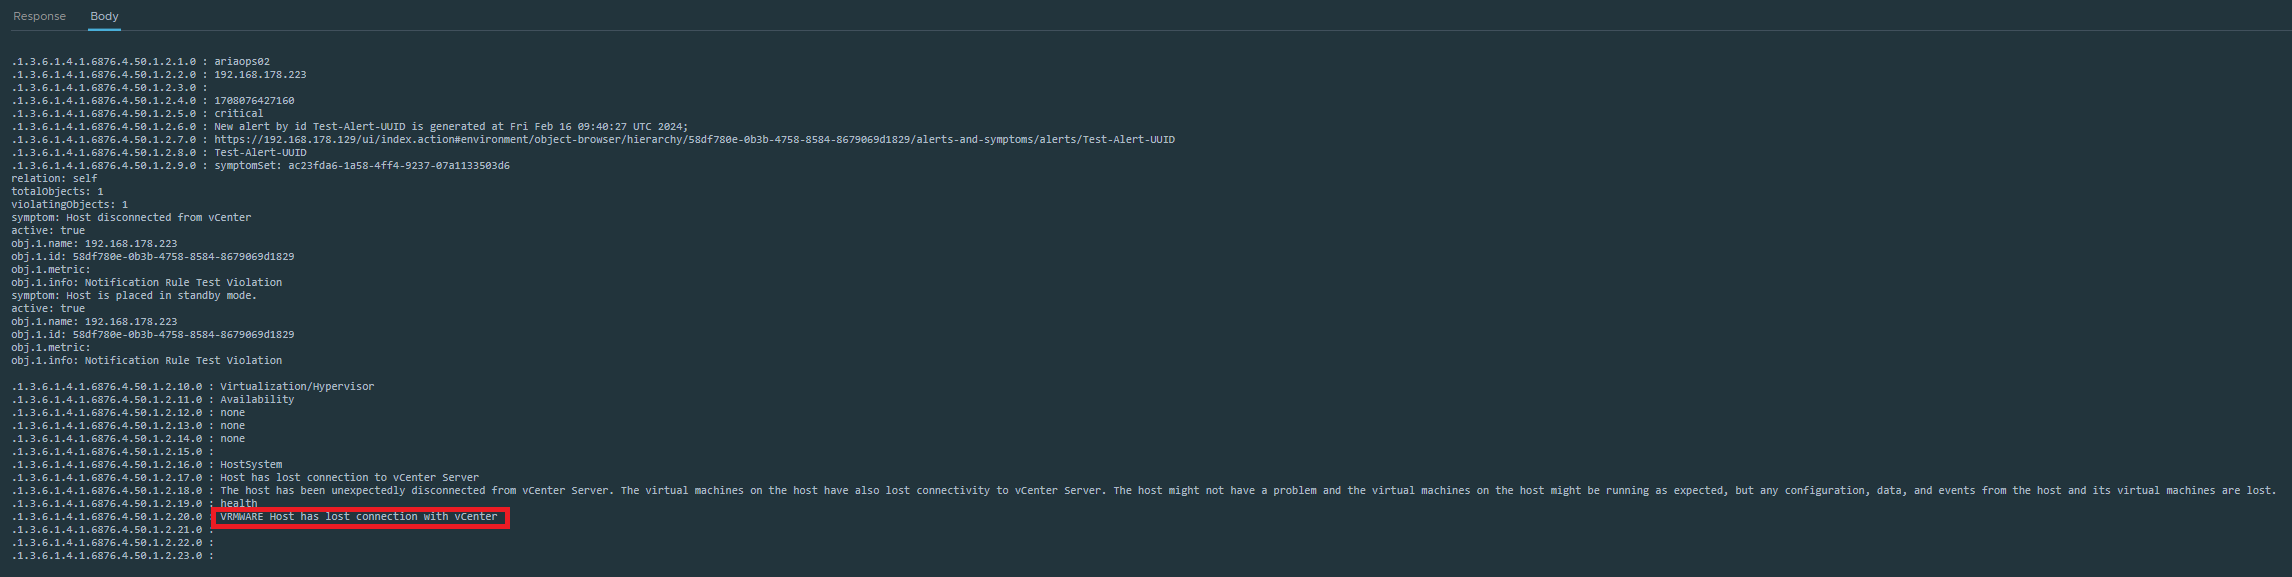
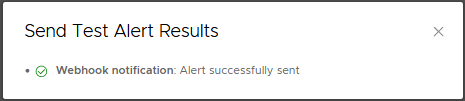
If everything is configured correctly we should receive the Send Test Alert Results after sending a test alert.
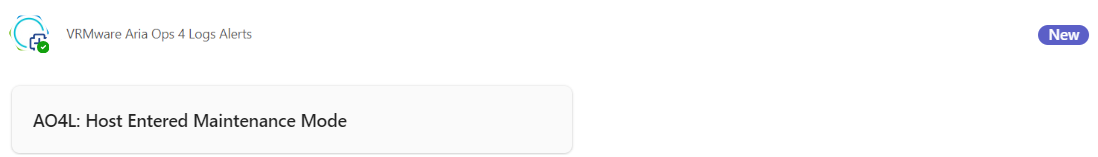
Save the Alert. Now we are ready for the final test. I put a ESXi host in maintenance mode and we should receive within 5 minutes a MS Teams notification. It works!
I hope this blog post will help you configure AO4L to send notifications to MS Teams. Please remember that MS Teams is not a monitoring tool. So be selective with the alerts you forward.