Almost two years ago I wrote a blogpost about a failure during installing the vCenter Server agent(HA) service. This post is one of most read articles on my blog. You can find the orginal post here. Recently, I ran into this problem again. This time I could not solve the problem using my earlier post.
I have found a workaround to this problem that is easy to implement and works well. I have been able to use it successfully several times recently.
Put the ESXi host in Maintenance Mode
SSH to the ESXi host
esxcli software vib remove -n vmware-fdm (no reboot needed)
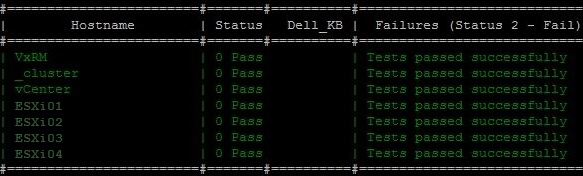
Wait a few minutes and the result should like this:
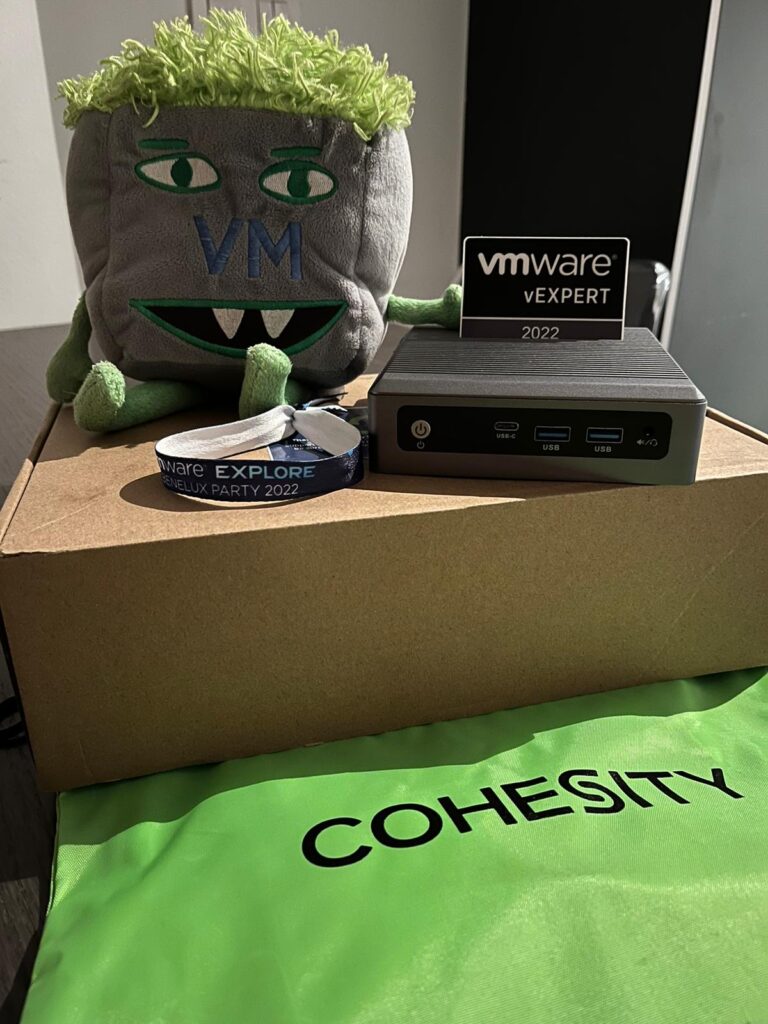
Last week was VMware Explore Europe in Barcelona, Spain. Here vExperts were able to pick up a mini PC, the Maxtang EHL30. The mini PC was offered by the vExpert community and Cohesity. This as a gift for all the work vExperts do for the vCommunity.
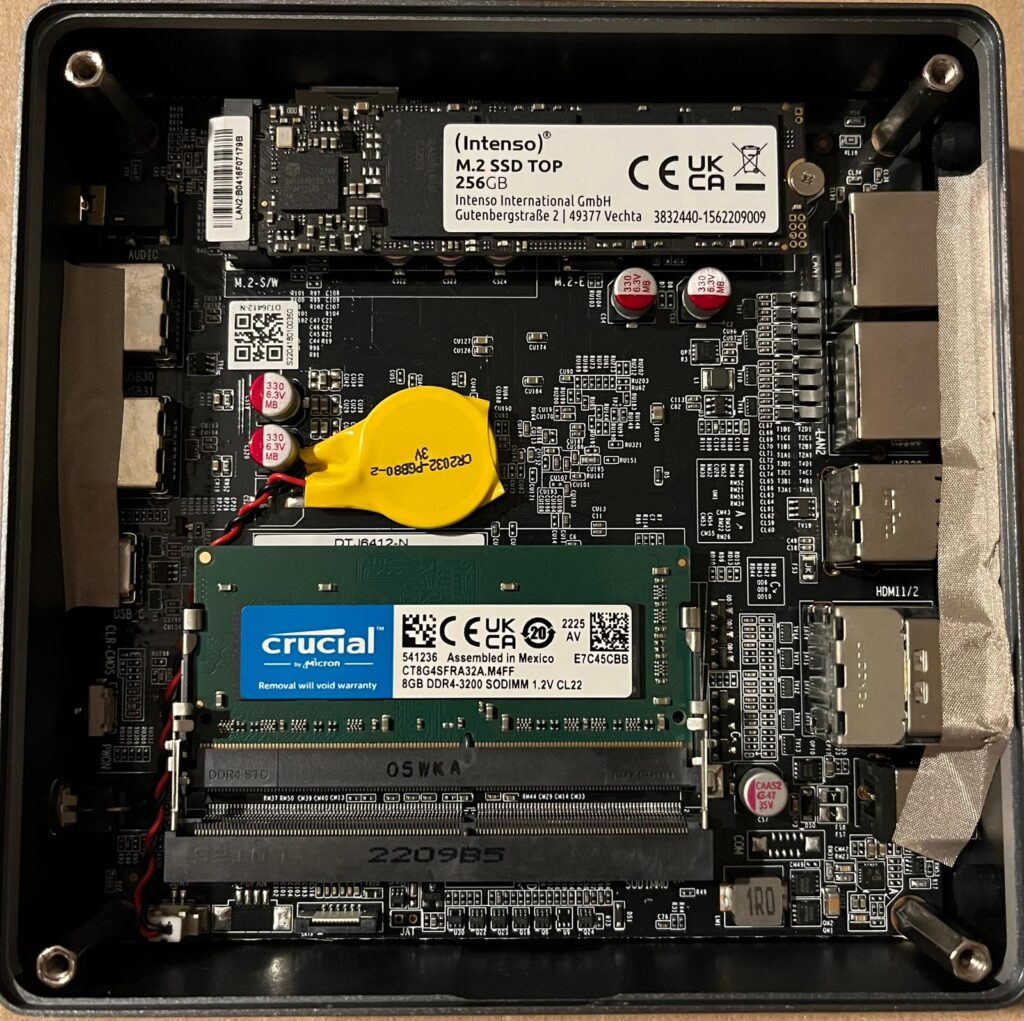
The mini PC still had to be fitted with DDR4 memory and an M.2 SATA SSD. Since I wanted to keep it low budget I bought memory and an SSD on Amazon for about €50.
After inserting the memory and SSD, the Maxtang boots up. I have installed Ubuntu 22.04 LTS and used Rufus to create a bootable Ubuntu install USB media. After the setup was completed the system hung during the reboot. After a coldboot I observed that the startup was also take some minutes, much to slow in my opinion. After searching for a while I found the solution for the slow startup and hung during reboot/shutdown.
enter command “sudo vi /etc/modprobe.d/blacklist.conf” in terminal
add a new line “blacklist pinctrl_elkhartlake” , save and exit editor mode
enter command “update-initramfs –u” in terminal
reboot system, coldboot to apply change
Now the Maxtang EHL30 with Ubuntu 22.04 LTS Reboot and startup in a few seconds.
For a customer, I deployed a new vRealize Log Insight 8.10 cluster as a test. After initial installation and configuration of the first vRLI node I experienced a performance that was particularly bad. It wasn’t always this bad, but it frequently occurred.
The bad performance initially revealed itself when choosing one of the options in the menu on the left side of the screen. It seemed like the whole screen was frozen. After 10 till 30 seconds the requested information appeared.
I decided to first complete the cluster setup. After adding some vCenters and importing Content Packs, technically everything worked as designed. The bad performance was still there even after temporarily adding additional memory to the nodes.
During one of the moments that the performance was decreased I saw something in the lower left-hand corner. There were the following messages displayed:
Read <vRLI FQDN>
Transferring data from <vRLI FQDN>
Connecting to cdn.pendo.io
The last bullet was the key to resolve this issue. I searched some information about “cdn.pendo.io” and found this article about “Join or Leave the VMware Customer Experience Improvement Program“. At the bottom of the article is a section “What to do next”
After CEIP is enabled, when a user logs in to vRealize Log Insight, they see a banner at the top of their window that asks whether they want Pendo to collect data based on their interaction with the user interface.
If the user clicks Accept, Pendo collects their data and sends it to VMware
If the user clicks Decline, Pendo does not collect their data
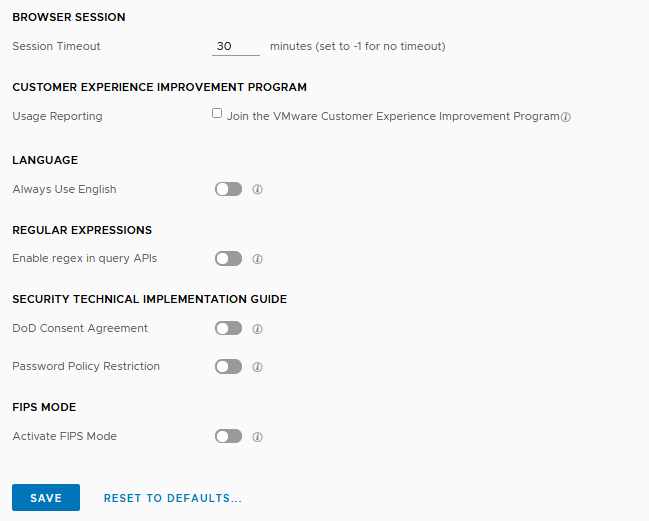
In the General Configuration section of the vRLI configuration I deselected the Usage Reporting (Join the VMware Customer Experience Improvement Program). This resolved the issue for me.
Finally, in this case there was no need to join VMware CEIP. So, therefore it is an acceptable solution for me.
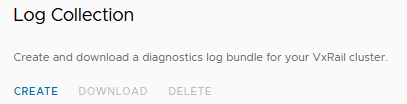
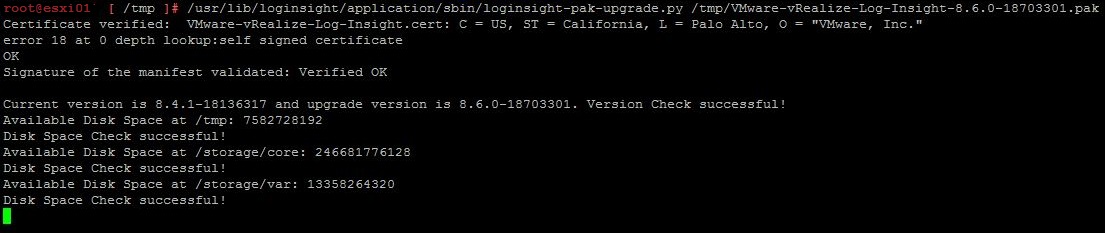
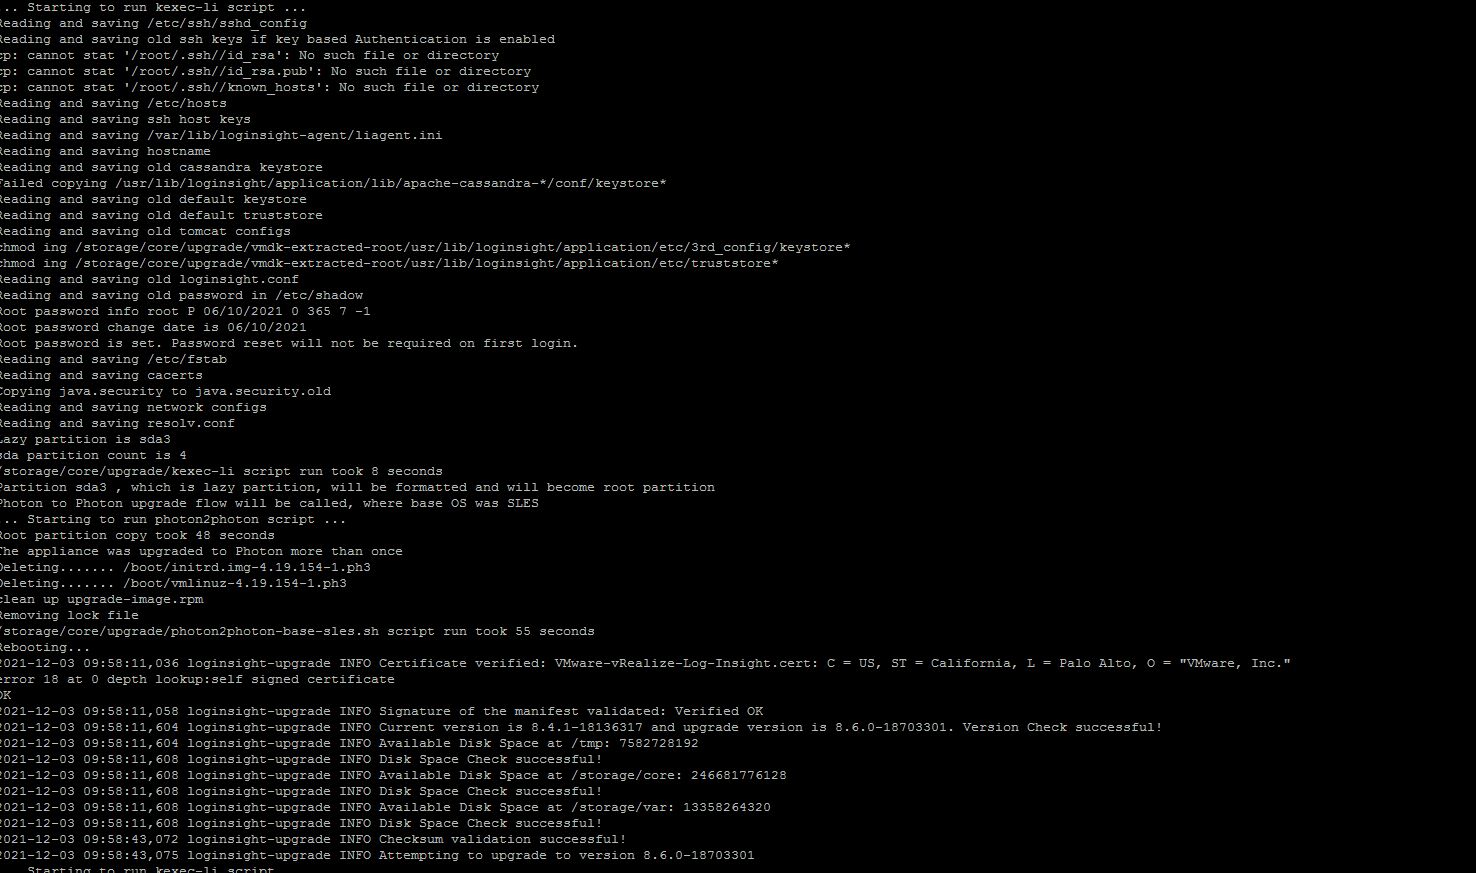
Recently I ran into a problem when I needed to generate a VxRail V7.x support log bundle. The log collection failed after I went to the VxRail log section.
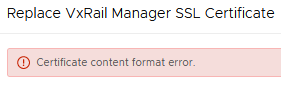
Cause: Replacing the VxRail Manager SSL Certificate through the Certificate Management Gui ended up with an error.
I was used to replacing the VxRail certificate using the cli. This was the preferred way somewhere up to version VxRail 4.7.x. All preparations for using the gui are the same as when replacing the certificate through the cli:
Config OpenSSL.conf with the required information
Create RSA key
Creare CSR file
Request a Certificate signed by your CA
Download Certificate CA chain
The certificate and CA certificate chain must still be in PEM format.
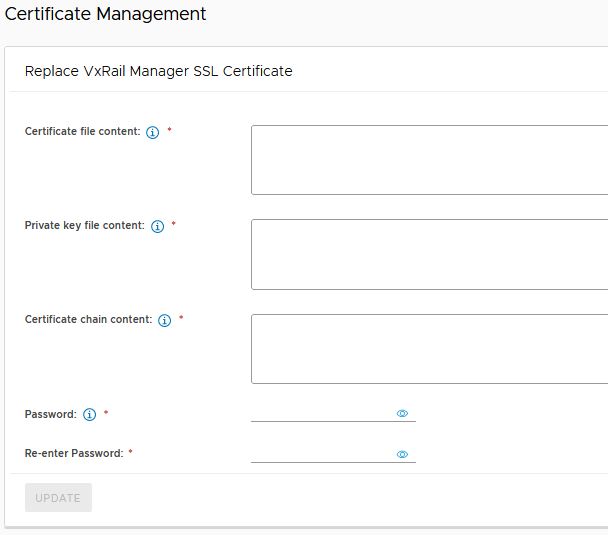
So I start with a snapshot of the VxRail manager and copied the VxRail certificate, RSA key, certificate chain and entered a password in the gui. After pressing the Update button I received the following error.
Solution: I will briefly tell you what went wrong. As told earlier, I used the same way to create the certifcates as I did when using the cli.
The error was caused by the certificate CA chain. After downloading the certificate CA chain file, the certificates are listed from top to bottom. The Root CA was at the bottom. This is order has always worked when replacing the VxRail manager certificate using the cli.
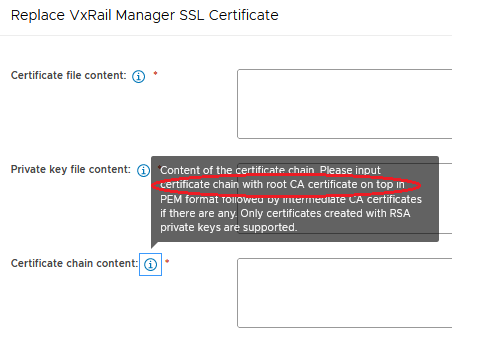
I was led to the solution after reading the certificate chain content information twice, see the screenshot above here. I assumed that the certificate format was causing the issue. There is also information about the certificate format next to the information about the order of the CA certificates in the chain file. I changed the order of the CA certificates in chain file with the Root CA on top.
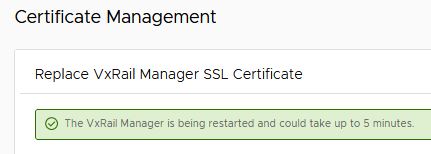
At the next try I copied again the VxRail certificate, RSA key and certificate chain and entered a password in the gui. After pressing the Update button I received a notification that the VxRail Manager certificate is successful replaced. It takes about 5 minutes, before the VxRail manager is back online.
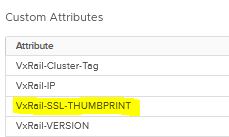
During this 5 minutes the VxRail SSL Thumbprint in the cluster in vCenter will be updated and services will be restarted. You can see the VxRail SSL Thumbrint on the cluster summary page in vCenter.
This auto replacement of the VxRail SSL Thumbprint is an enhancement compared to the old way when the certificate was replaced using the cli. The VxRail SSL Thumbprint then had to be manually read and copied from the VxRail manager to the cluster custom attribute in vCenter.
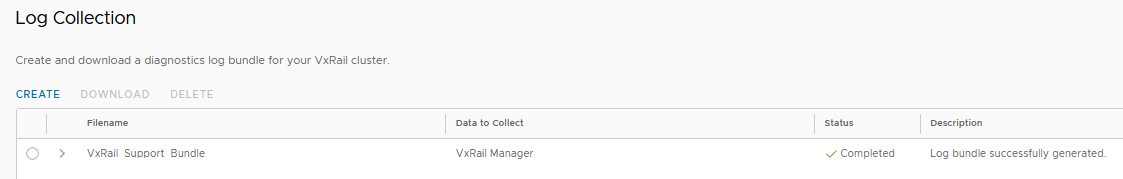
Return to the VxRail System info page after 5 minutes. You should now see the VxRail information.
This post is written by Steve Hagerty. Since I find this a very valuable blog, I have decided reblogging this article. The original article can be found here.
This is a short post to explain how to configure syslog forwarding from VxRail Manager to vRealize Log Insight.
Depending on the deployment scenario, VxRail may or may not be automatically configured to forward all of its associated logs to vRealize Log Insight. For example with VCF on VxRail, this configuration is automated for all VxRail components, while in other situations this may need to be configured manually.
There are three primary VxRail components to configure:
VxRail Manager
vCenter Server
ESXi Hosts
… with the iDRAC of each VxRail node also being an option.
The configuration of the VxRail vCenter Server in vRLI can also incorporate configuring the log forwarding from the associated ESXi hosts if selected, as shown below:
This is all managed under the built-in vSphere integrations for vRLI. What remains then, if required, is to configure VxRail Manager to forward its logs (marvin.log) to vRLI.
As described in KB504644 VxRail: How to configure a new syslog server , SSH to VxRail Manager as mystic user and switch user to root user, before editing the /etc/rsyslog.conf file with the following additional entries:
Advertisementshttps://c0.pubmine.com/sf/0.0.3/html/safeframe.htmlREPORT THIS ADPRIVACY
Ideally you should use the Log Insight load balancer IP as the target for the <customer remote server ip> (syslog/vRLI server IP), where 514 is the udp port.
Update 31/03/2021: In additional, to the above, the /var/log/mystic/connectors-cluster.log and the /var/log/mystic/connectors-esrs.log can be added to this list, simply by adding them as additional $InputFileName line items, as shown below:
Restart the syslog service using command on VxRail Manager: service rsyslog restart (or reboot the VxRail Manager VM if required).
We can then confirm that the vRLI system is receiving the forwarded logs from our VxRail Manager (vcf2mgmtvxrmgr) in the vRLI UI under Administration > Hosts
Advertisementshttps://c0.pubmine.com/sf/0.0.3/html/safeframe.htmlREPORT THIS ADPRIVACY
On the Interactive Analytics tab we can filter for the VxRail Manager hostname of vcf2mgmtvxrmgr in order to get more detail on each event received since the log forwarding was configured.
The events received from the VxRail Manager source will automatically be included in the General vRLI Dashboard, as shown below
It is also possible to create your own custom VxRail dashboard in vRLI if required. A new (VxRail) dashboard can be created under My Dashboards, where new and existing widgets can be copied and modified as required.
For completeness, if a customer requires the iDRAC logs of the VxRail nodes to be forwarded to vRLI also, then please take a look at this post which covers the required steps, leveraging the Dell iDRAC Content Pack for vRLI, installable directly from the vRLI Content Pack Marketplace, as shown below:
Advertisementshttps://c0.pubmine.com/sf/0.0.3/html/safeframe.htmlREPORT THIS ADPRIVACY
Recently I was asked if it is possible to receive an email notification if a vSAN storage policy with Force Provisioning enabled is applied to a vm. In this blogpost I want to show that this is possible.
Use Case – An administrator wants apply an vSAN storage policy with Force Provisioning enabled to virtual machines beacause of a possible shortage of vSAN storage capacity. In my opinion not a very good idea in a production environment!
Goal – Get an email notification when a vSAN storage policy with Force Provisioning enabled is applied to an vm. There is also the wish to make this visable in a dashboard.
Solution – With a bit of reverse engineering and vRealize Log Insight (vRLI) it’s possible to achieve this.
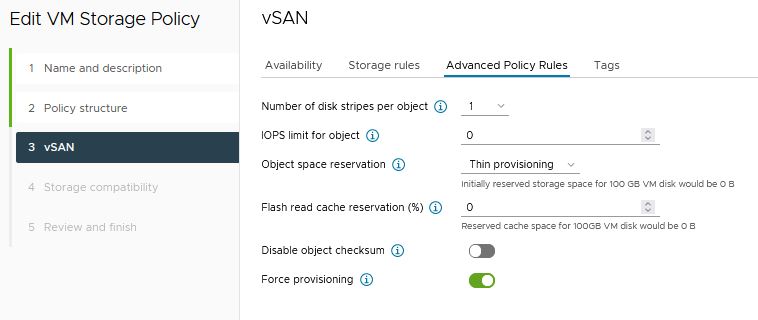
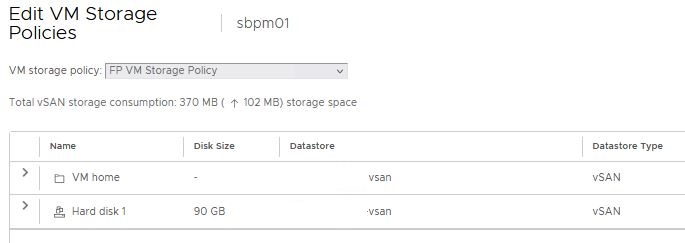
The first step is create a storage policy with Force Provisioning enabled. We name this policy “FP VM Storage Policy”
We need to apply the new storage policy “FP VM Storage Policy” to our test vm “sbpm01”
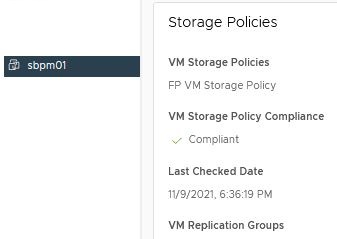
The policy is successful applied to the vm “sbpm01”.
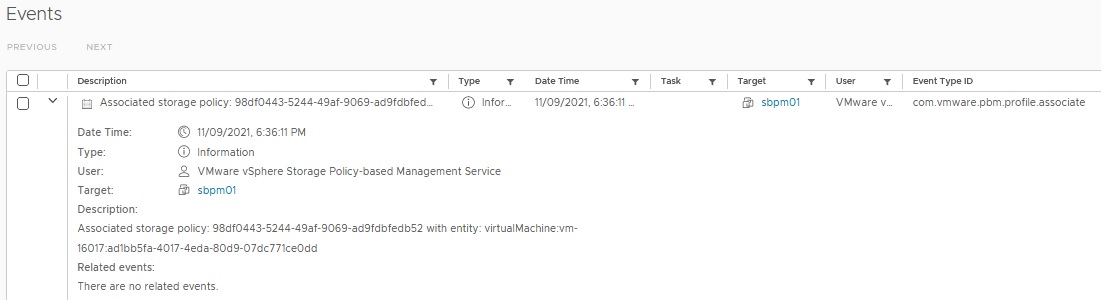
Now we need some reverse engineering because it’s not possible to grep the name of the storage policy in vRLI. We move to the sbpm01 events in vCenter.
This is the information we need to created a new filter in vRLI Interactive Analytics.
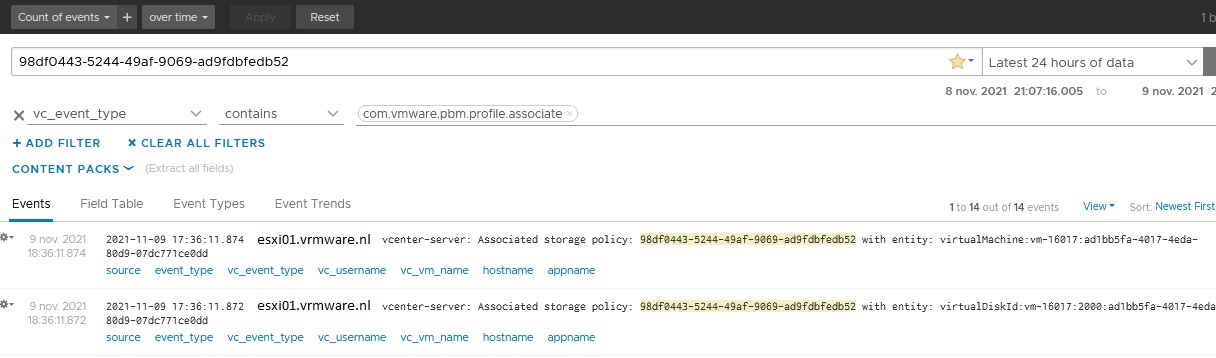
Add the associated storage policy id “98df0443-5244-49af-9069-ad9fdbfedb52″ to the text field and add an extra filter (+ ADD FILTER). Choose from the pull down menu “vc_event_type” contains com.vmware.pbm.profile.associate. Choose a time window. In our example I choose “Latest 24 hours of data”. You can also choose here the last hour or last 5 minutes of data. It depends on the time you applied the policy and when you search in vRLI.
In de results above you don’t see the name of the vm with the applied storage policy. In the last image above here you see on the right of Events the Field Table section. Select Field Table. Search for the row with name vc_vm_name. Below here is the vm friendly name displayed of the vm with new applied storage policy.
Finally you want a email notification and a dashboard. I am not going to explain here how to create an email notification and a dashboard. This can be done in vRLI at the same way you normally create notifications and dashboards. Press the icon (1) to create a email notification and press the icon (2) to create a dashboard.
If you want receive an email notification if the vm get another storage policy applied. Then you should create another filter including the following two details.
In this blog post I wanted to demonstrate that it is possible with vRLI to receive an email notification if a vm has a storage policy applied where Force Provisioning is enabled. A disadvantage is that if the vm gets a different storage policy with different settings, this email notification is no longer valid, because the notifications are based on this specific storage policy id.
I have shown that it is works but as far as I believe it is not a solution for a production environment.
VxRail software version 7.0.300 includes VMware ESXi 7.0 Update 3, VMware vSAN 7.0 Update 3 and VMware vCSA 7.0 Update 3a with support for external storage and introduction to satellite nodes.
New features
Operationalize the edge with VxRail satellite nodes: You can deploy the E660, E660F, and V670F as single VMware vSphere nodes with no VMware vSAN to address VxRail edge deployments that require a smaller footprint. You can configure satellite nodes with an optional PowerEdge RAID controller to add resiliency for local disks. The satellite nodes are managed by a new or existing standard cluster with VMware vSAN running 7.0.300.
Control satellite nodes from a central location: You can deploy a VxRail Manager VM that can control all satellite nodes from a centralized host management location in VMware vCenter. You can add, remove, and update satellite nodes from one access point using VxRail Manager.
Expanded storage option for VxRail dynamic nodes: You can deploy VxRail dynamic nodes as part of a PowerFlex 2-layer architecture. Deploy VxRail dynamic nodes cluster as compute only node leveraging PowerFlex storage for hosting the workload VMs.
Protocol support for VxRail dynamic nodes: NVMe-FC is supported with PowerStore and PowerMax storage arrays that are attached to dynamic nodes.
VMware ESXi 7.0 Update 3, VMware vSAN 7.0 U3, VMware vCSA 7.0 Update 3a support. The major changes for VxRail include: Support upgrade of the VMware vSAN Witness Host (dedicated) in vLCM as part of the coordinated cluster remediation workflow for VMware vSAN 2-Node and Stretched Clusters.
Stretched Cluster Enhancement to allow the ability to tolerate planned or unplanned downtime of a site and the witness in a stretched cluster deployment.
Sometimes you run into an issue that can keep you busy for hours and afterwards the cause remains easy to solve. Recently I ran into such an issue.
There was a minor update that needs to be done. It was a VxRail code upgrade from 7.0.x to 7.0.2xx.
The upgrade was basically like all other upgrades:
Run VxVerify
If there are findings in the results, solve them before starting the upgrade
Upload the desired VxRail target code
Start the upgrade
Done
The results of the vxVerify were fine, no issues detected.
While uploading the target VxRail code everything looks fine but during the extraction of the upgrade bundle it failed at 50%. So I start a retry but the extraction of the upgrade bundle failed again at 50%. At the Cluster level we noticed the following error.
VXR1F4114 ALARM Upload of upgrade composite bundle unsuccessful VxRail Update ran into a problem… Error extracting upgrade bundle 7.0.2xx. Failed to upload bundle. Please refer to log for more details.
I opened a support request by Dell Support and in the meantime I start to examine the lcm-web.log in /var/log/mystic. I found some errors and failures but they did not lead directly to the root cause. There were errors about upgrade bundles couldn’t uploaded but those events were too general. I noticed the VxRail node that was mentioned at last in the log before the extraction failed.
Dell Support was now also working on the case. The support engineer also noted that the VxRail node I suspected was causing the problem.
I won’t go into too much detail, but at some point we checked the status of the “dcism-netmon-watchdog” service on that particular VxRail node.
[root@ESXi03:~] /etc/init.d/dcism-netmon-watchdog status iSM is active (not running)
I had seen recently the same service status on another VxRail nodes running on code 7.0.x. Restarting the service won’t start the service. So I restarted the VxRail node. After the restart it could take some minutes before the service is restarted. I checked the service again.
[root@ESXi03:~] /etc/init.d/dcism-netmon-watchdog status iSM is active (running)
Finally we restarted(retry) the VxRail code extraction. Both the VxRail code extraction and VxRail upgrade were successful.